

Four years ago, in October 2022, a major U.S. stock index hit its lowest point during a painful downturn. At that time, prices for everyday goods were rising faster than they had since the 1970s, the Federal Reserve (the U.S. central bank) was quickly raising interest rates to slow inflation, and many people feared a recession was coming. Consumers, businesses, and investors all felt deeply pessimistic, and it was hard to imagine things getting better.
Today, the picture looks very different. Major stock indexes are close to all-time highs, the economy has held up well, companies have grown their profits, and unemployment has stayed low. Inflation remains a challenge, with energy prices being a key source of uncertainty this year, but prices are no longer rising at a double-digit pace.1 The S&P 500, a widely followed measure of U.S. stock performance, has more than doubled since that low point. This has rewarded investors who stayed the course and kept a long-term focus.
Now entering its fifth year, this bull market (a period of generally rising stock prices) serves as a powerful reminder that conditions can improve even when things look their worst. Rather than celebrating or becoming overconfident, the right approach is to stay balanced and keep long-term financial goals in focus.
Keeping perspective as the bull market enters year five
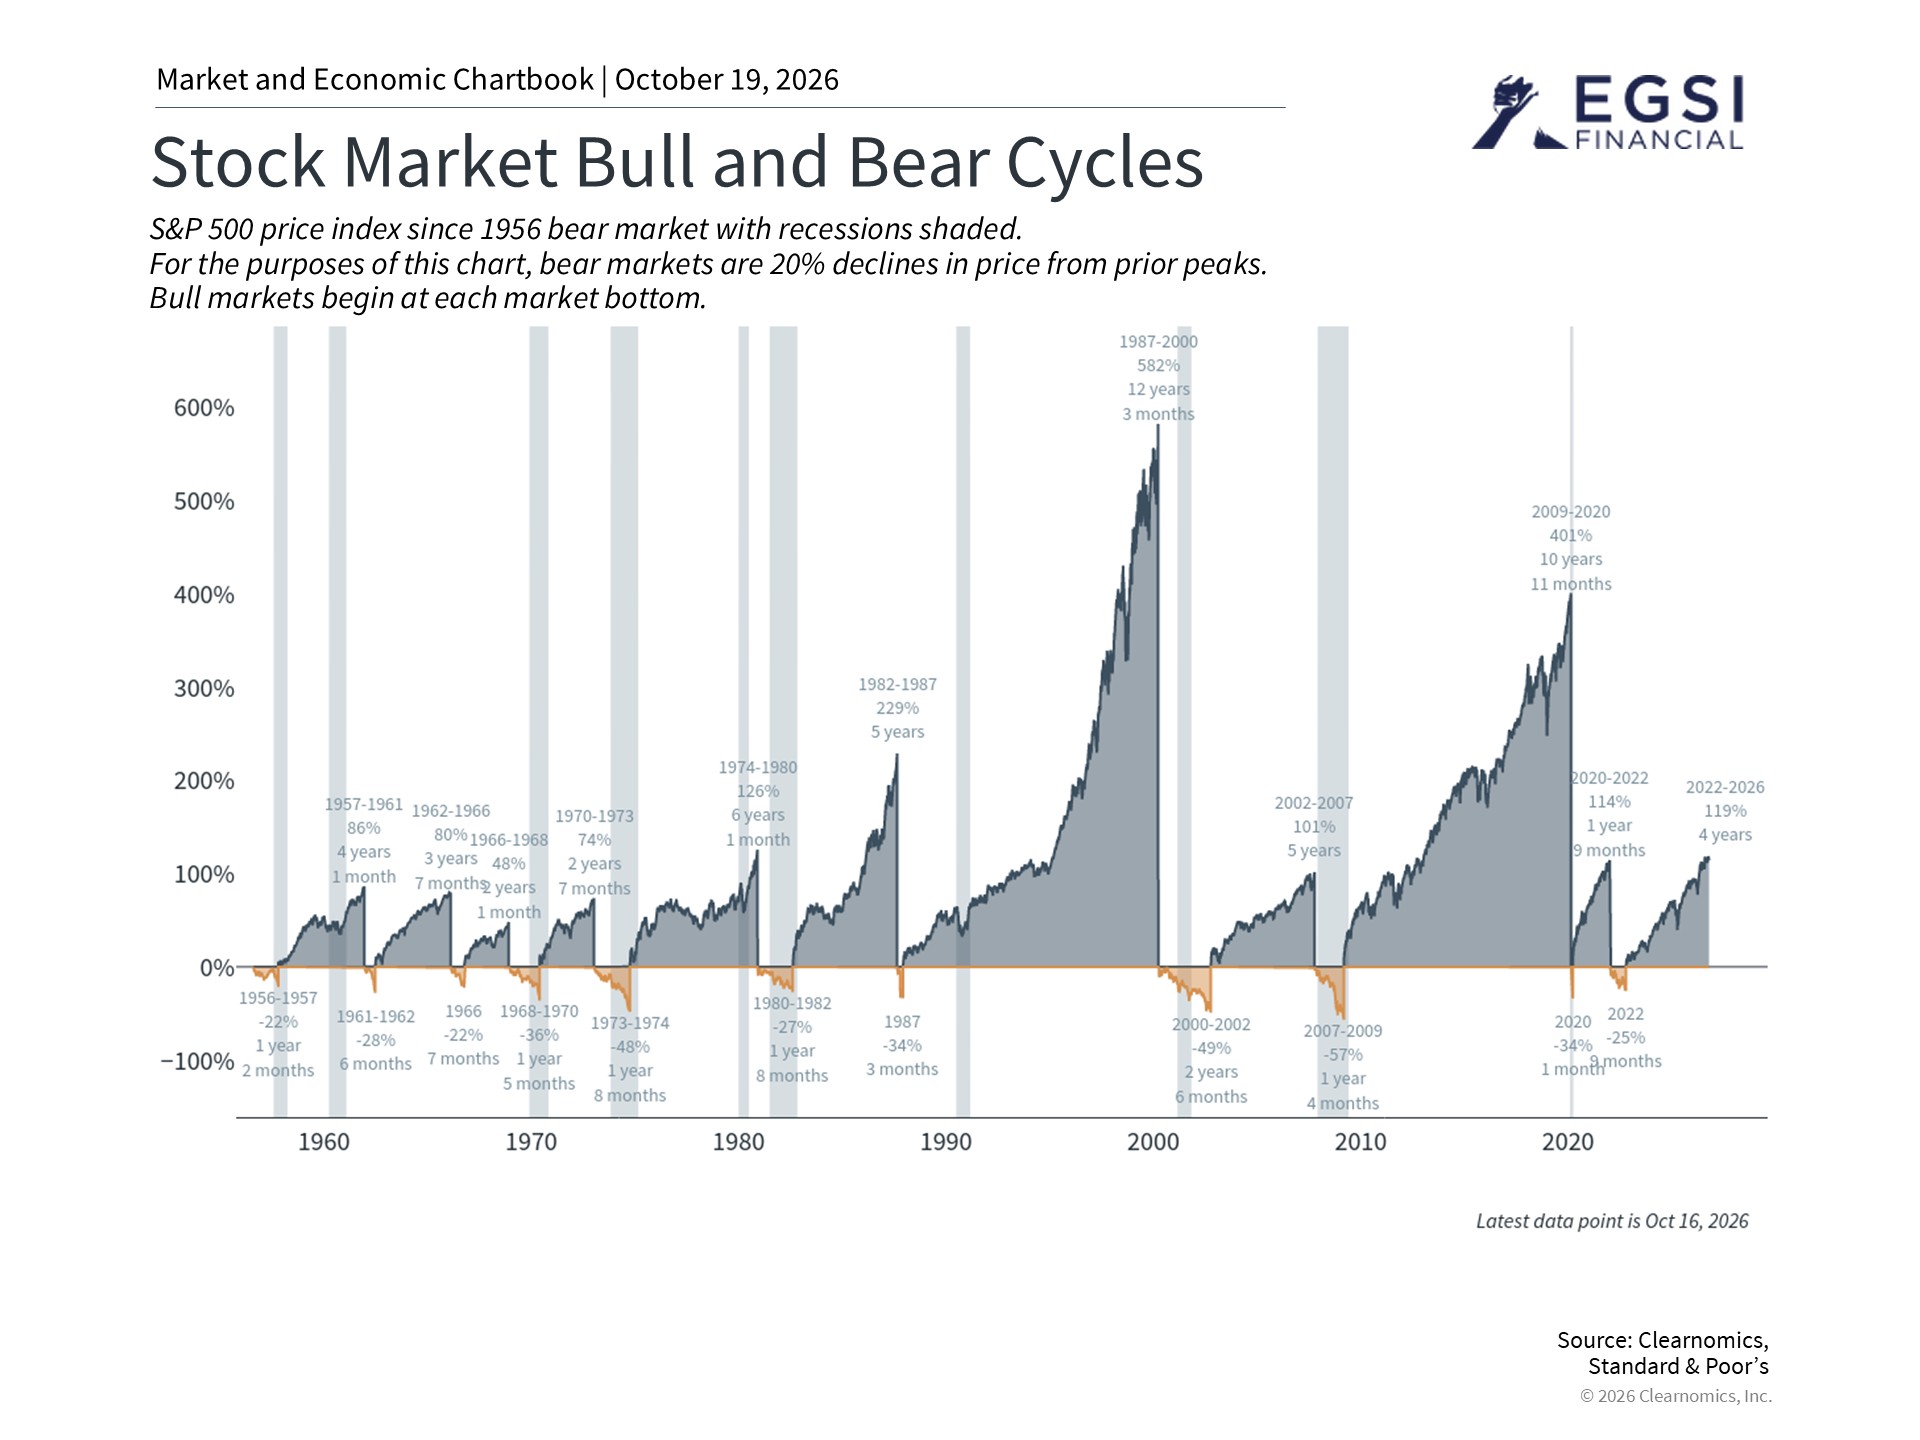
The S&P 500 reached its lowest point on October 12, 2022, along with other types of investments like bonds, as inflation worried markets. Since then, the index has climbed roughly 119% based on price alone, and about 131% when dividends (payments companies make to shareholders) are reinvested.2 This means that stock holdings have more than doubled over this stretch, making this one of the strongest bull market runs since World War II, as shown in the chart above.
Historically, bull markets (rising markets) have lasted far longer than bear markets (falling markets), often running for five to ten years or more. Two recent cycles each lasted over a decade. Of course, every market cycle is different, and past performance does not guarantee future results. Markets never rise in a straight line.
The market cycle that began in 2020, for instance, was interrupted in 2022 due to inflation. Yet many challenges that seemed serious at the time turned out to be temporary setbacks. The long bull markets of the 1990s and the 2010s each faced serious obstacles along the way, including concerns about economic growth, geopolitical events, government budget pressures, oil price shocks, and periods when stocks seemed expensive. Consumers and businesses adapted, and markets recovered.
The current cycle has been no different. It has already seen sharp drops, such as the pullbacks in 2025 related to tariffs and earlier this year due to the war in Iran. Looking at the bigger picture, these episodes are a normal part of any market cycle. As the bull market continues, it remains important for investors to hold a well-built portfolio that can weather different types of market conditions.
Reaching new all-time highs is a regular part of a healthy bull market
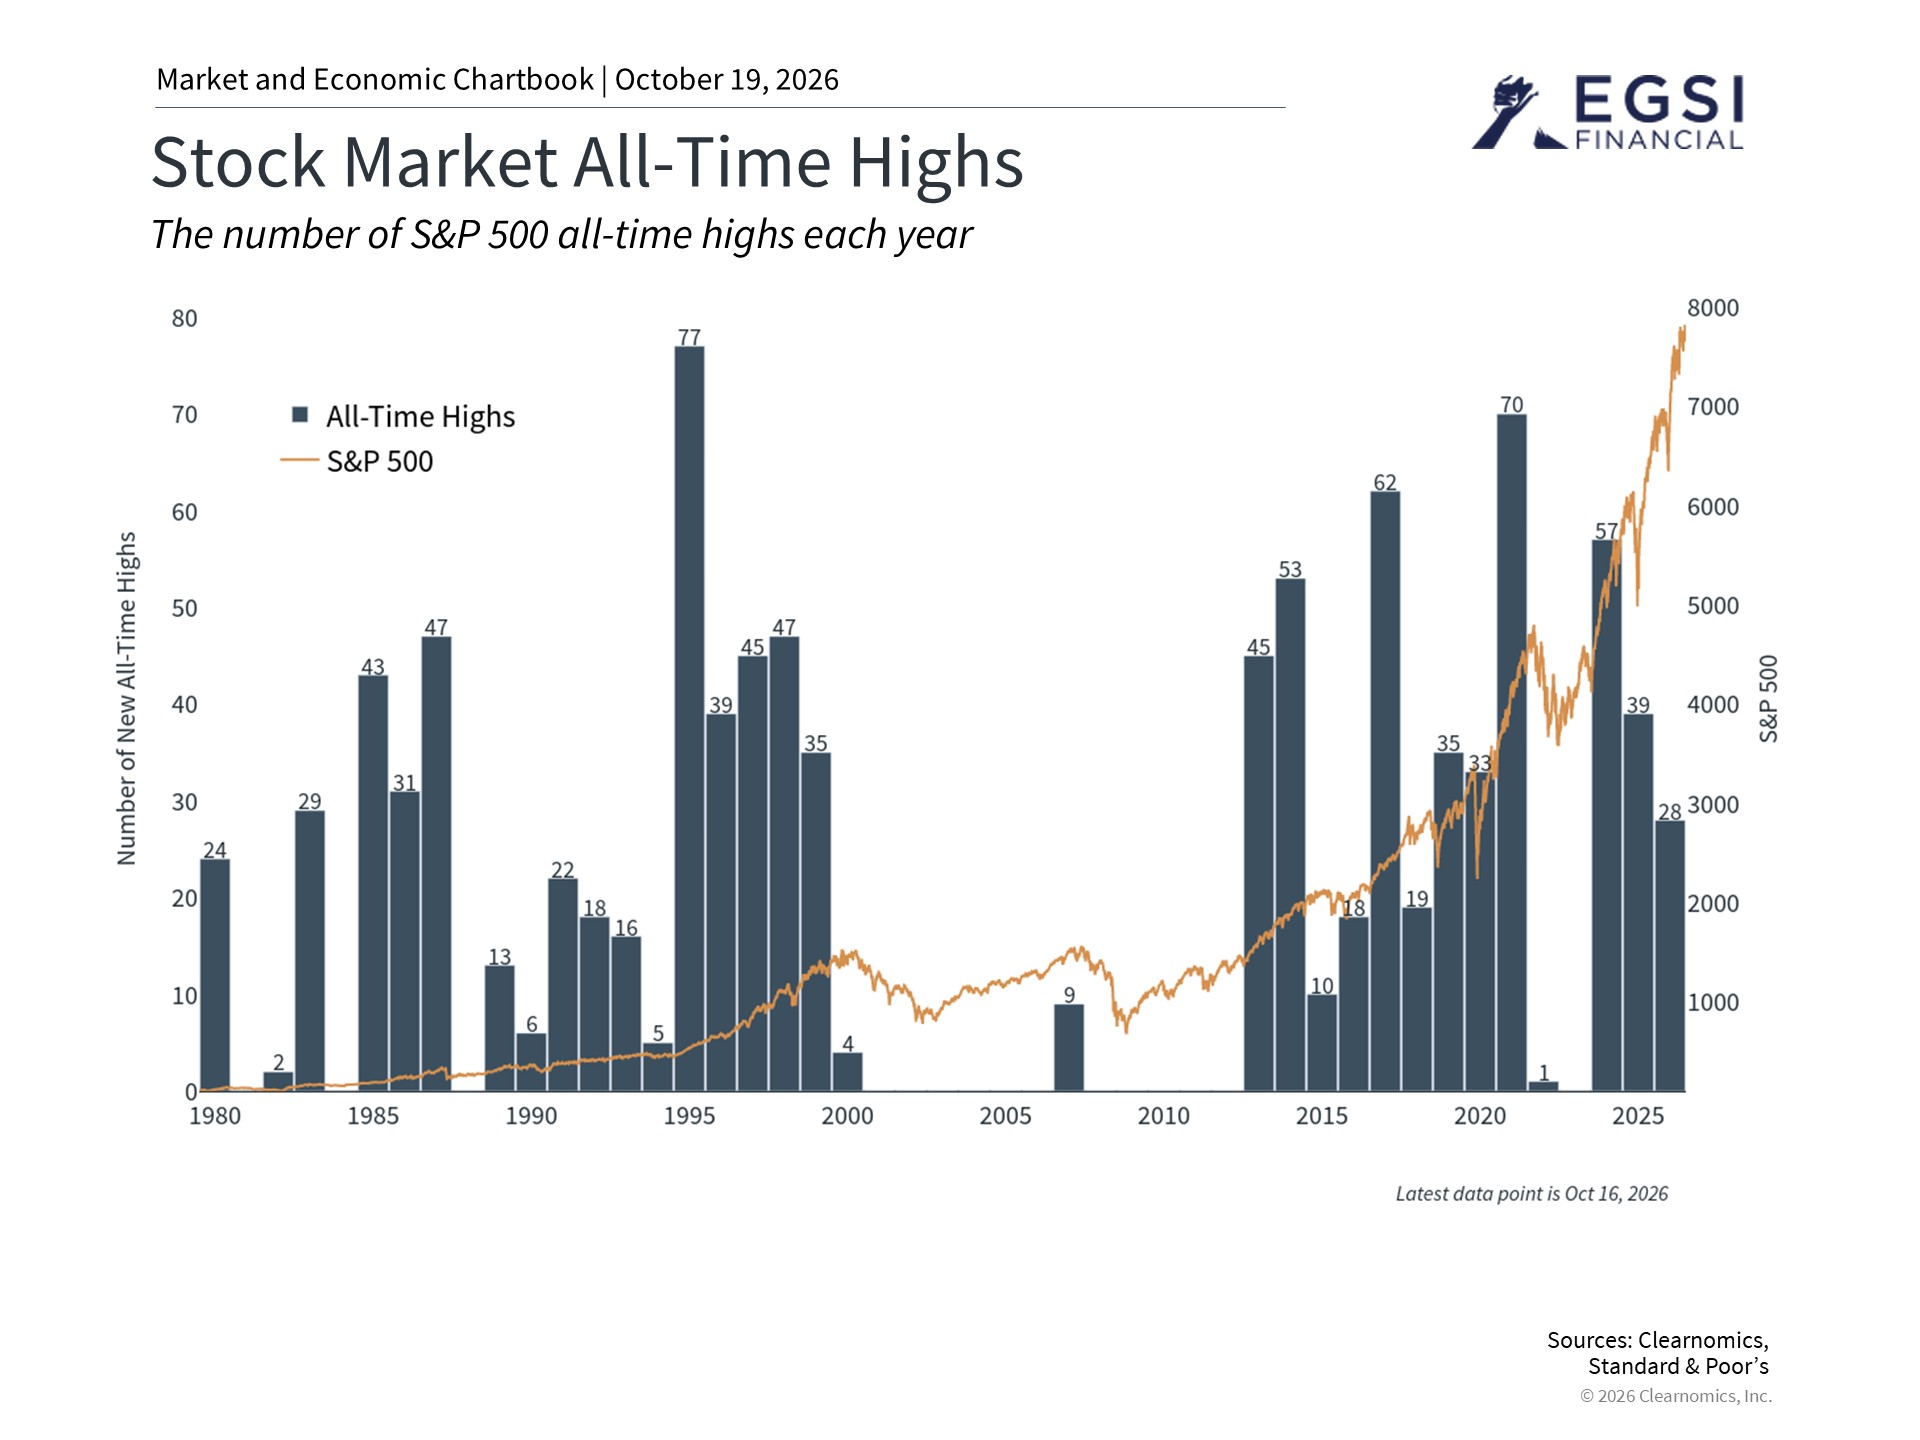
The market has not just kept going but has hit record levels. This year alone, the S&P 500 has set more than two dozen new all-time highs.3 This can create mixed feelings. Some investors worry the market is “due for a pullback,” while others feel they may be missing out. Both reactions are understandable, but neither is a helpful guide for long-term decision-making.
As always, staying balanced and keeping a longer historical perspective matters. The chart above shows how often the S&P 500 has set new all-time highs across different market cycles. History shows it is completely normal for markets to rise steadily during bull markets and set new records along the way. Over the past decade, the S&P 500 has reached dozens of new highs each year, except during the bear market in 2022 and as major indexes were recovering in 2023.
This does not mean there are no risks, or that new highs should be taken for granted. It reflects the fact that the economy and businesses have stayed strong despite real challenges. One of the most valuable habits a long-term investor can build is recognizing this pattern and resisting the urge to step aside every time markets approach record territory.
Valuations have come down somewhat, but managing risk still matters
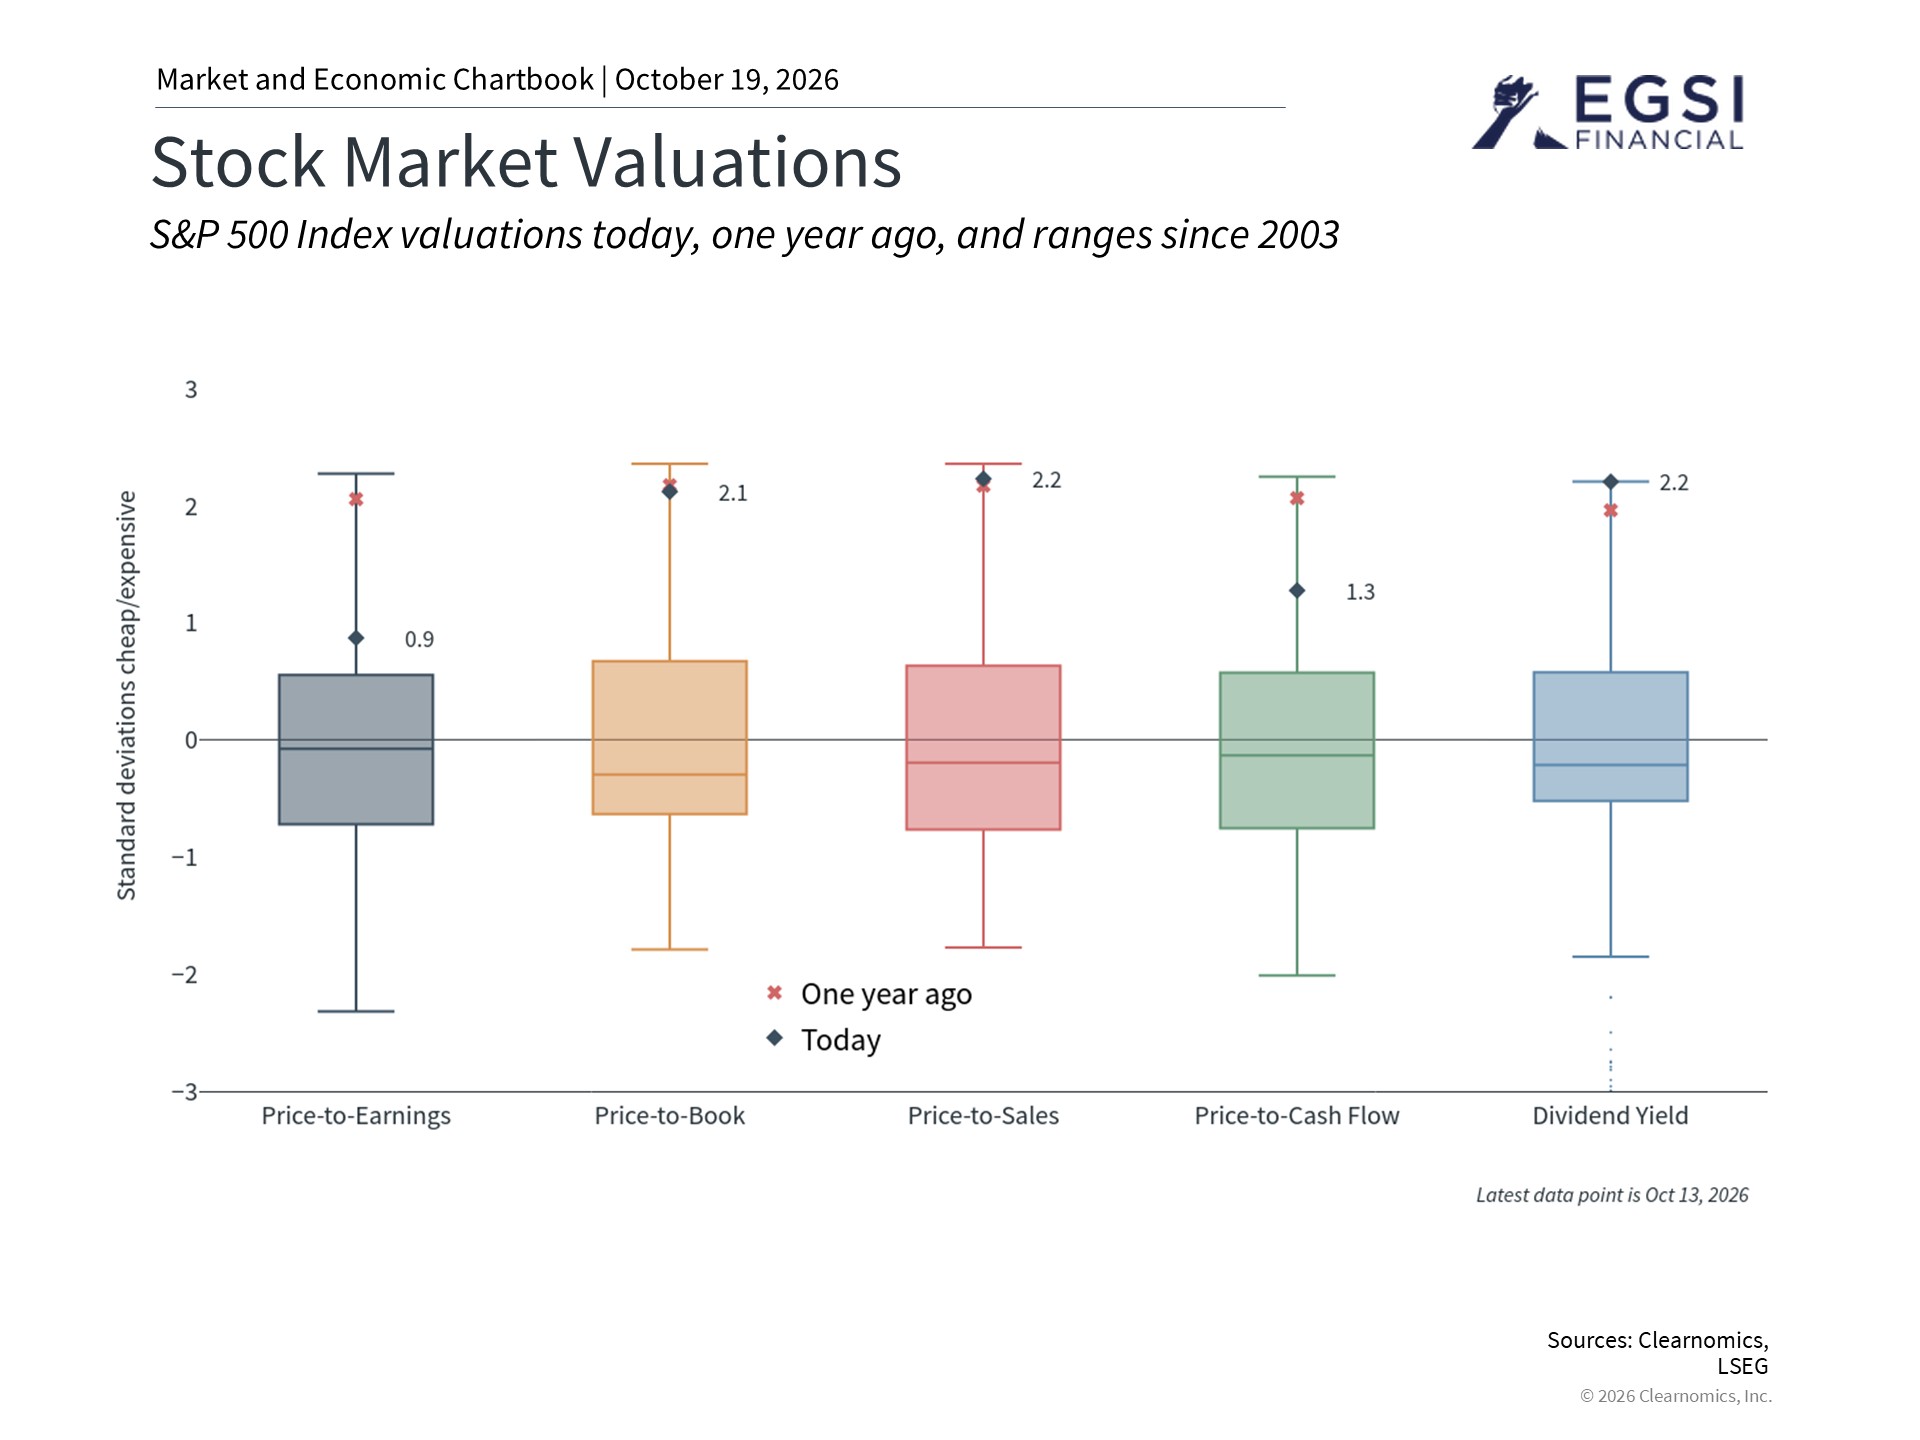
With markets near high valuations (measures of how expensive stocks are relative to what companies actually earn or own), it is worth thinking about opportunities across different types of investments and how to manage risk. Valuations matter because they show not just what you pay for a stock, but what you get in return. Investors buy stocks to benefit from the profits, cash flow, dividends, and other financial results that companies produce. Valuation measures compare the stock price to these results to show whether the price seems reasonable.
The chart above shows several valuation measures for the S&P 500. Strong earnings growth over the past year, including forecasts pointing to over 30% earnings growth for 2026, has helped bring the price-to-earnings ratio (how much investors pay per dollar of company profit) down from its peak about a year ago.4 This is a positive sign, suggesting that much of the market’s gains have been driven by actual company profitability rather than investor excitement alone.
At the same time, valuations remain above their long-run historical averages by other measures. The price-to-book ratio, a classic measure used by value investors that compares stock prices to company assets, still suggests the market is expensive. Dividend yields (the dividend paid out as a percentage of the stock price) are also historically low compared to current interest rates and bond yields. It is also worth noting that valuations look high mainly in technology-related sectors and can vary widely across different parts of the market.
Valuations are not tools for predicting short-term market moves. Instead, they help investors position their portfolios wisely over years and decades. Markets can stay at elevated levels for long periods, especially when earnings are growing strongly. That said, higher valuations suggest there is less room for error if conditions change. This highlights the importance of holding a mix of different asset classes to keep a portfolio balanced and aligned with long-term financial goals. Bond yields, for example, are near multi-decade highs, making them more attractively valued relative to recent history.5
The bottom line? As the bull market begins its fifth year, it’s a good time to reflect on the positive developments over this market and economic cycle. Uncertainty is a natural part of investing, so staying balanced and focused on long-term financial goals remains important.
References
1. https://www.bls.gov/news.release/cpi.nr0.htm
2. Clearnomics research using Standard & Poor’s data, from October 12, 2022 to October 9, 2026
3. Clearnomics research and S&P 500 data, as of October 9, 2026
4. Clearnomics research and LSEG data, as of October 9, 2026
5. https://home.treasury.gov/policy-issues/financing-the-government/interest-rate-statistics
Index Descriptions
S&P 500
The Standard & Poor’s 500 Index is a capitalization-weighted index of 500 stocks designed to measure performance of the broad domestic economy through changes in the aggregate market value of 500 stocks representing all major industries. The modern design of the S&P 500 stock index was first launched in 1957. Performance prior to 1957 incorporates the performance of the predecessor index, the S&P 90.
We are an independent financial services firm helping individuals create retirement strategies using a variety of investment and insurance products to custom suit their needs and objectives.
Advisory services offered through EGSI Investment Management, Inc., a Registered Investment Advisor with the State of Ohio. Insurance services offered through EGSI Financial, Inc.
Investing involves risk, including the potential loss of principal. No investment strategy can guarantee a profit or protect against loss in periods of declining values. None of the information contained on this website shall constitute an offer to sell or solicit any offer to buy a security or any insurance product.
Any references to protection benefits, safety, security, or steady and lifetime income streams on this website refer only to fixed insurance products. They do not refer, in any way, to securities or investment advisory products. Annuity guarantees are backed by the financial strength and claims-paying ability of the issuing insurance company. Annuities are insurance products that may be subject to fees, surrender charges and holding periods which vary by insurance company. Annuities are not FDIC insured.
The information and opinions contained in any of the material requested from this website are provided by third parties and have been obtained from sources believed to be reliable, but accuracy and completeness cannot be guaranteed. They are given for informational purposes only and are not a solicitation to buy or sell any of the products mentioned. The information is not intended to be used as the sole basis for financial decisions, nor should it be construed as advice designed to meet the particular needs of an individual’s situation.