

The housing market plays a major role in both everyday life and the broader economy. For most families, buying a home is a big goal that takes years of saving, and it often becomes their largest asset and biggest monthly expense. Housing also makes up between 15% and 18% of the country’s total economic activity.1 Because of this, changes in the housing market can affect how confident people feel about their finances and how fast the economy grows.
One of the biggest forces shaping housing is interest rates. When interest rates go up, the cost of borrowing money to buy a home goes up too. The average 30-year fixed mortgage rate (the interest rate on a home loan paid back over 30 years at a steady rate) has risen back above 7%. This is a level not seen consistently in nearly 25 years. So what does this mean for homebuyers and the overall economy?
Mortgage rates have climbed back above 7%
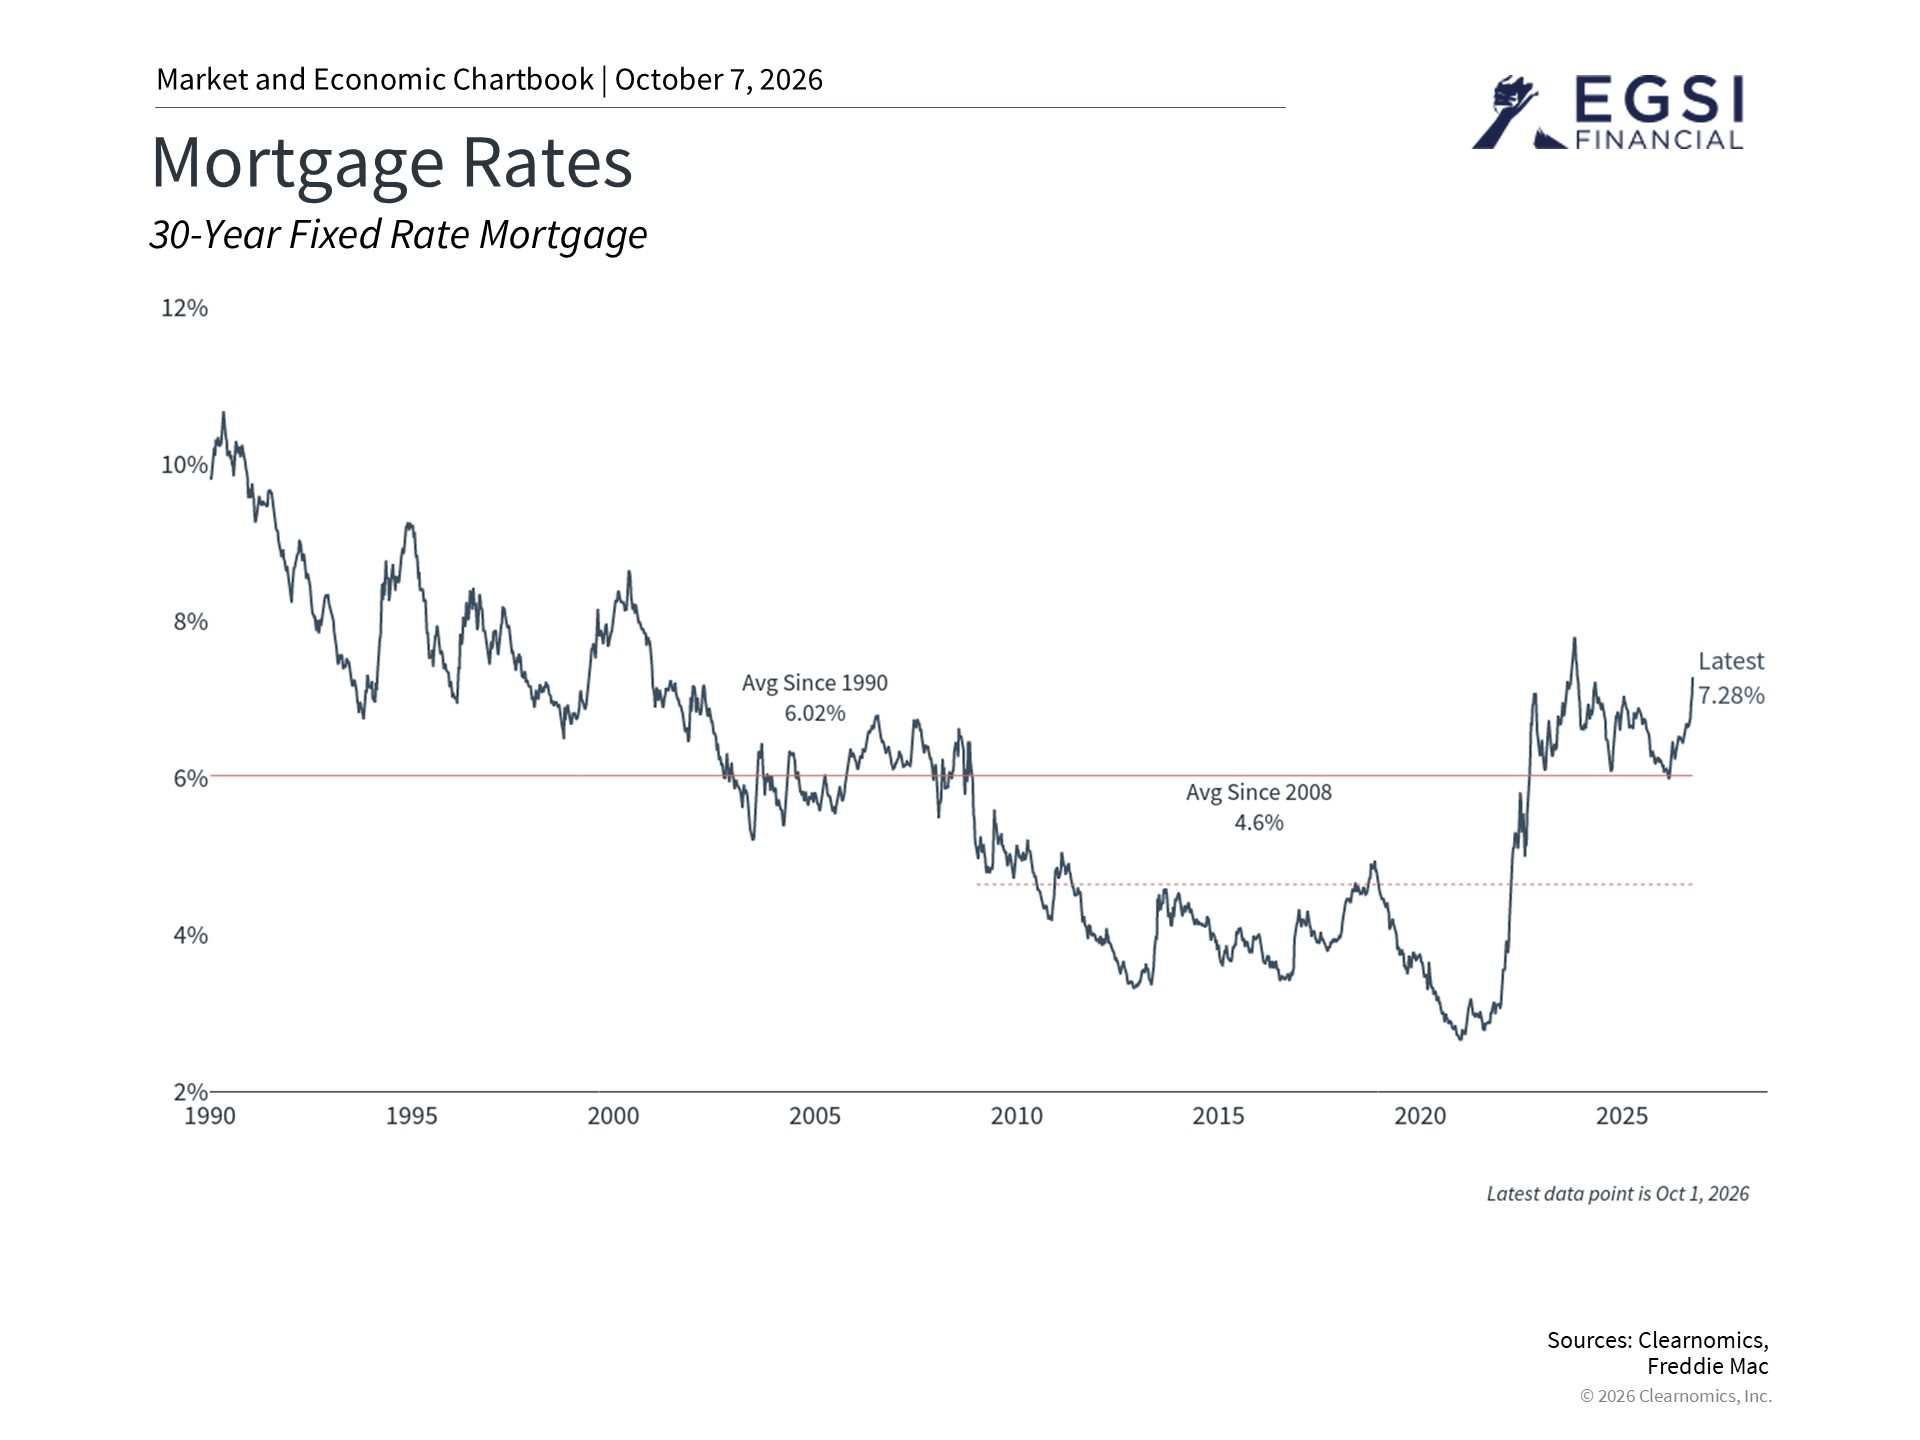
Mortgage rates had been falling for decades, hitting their lowest point during the pandemic when 30-year rates dropped to 3% or below. From 1990 to 2008, the average 30-year rate was about 6%. Since 2008, the average dropped to just 4.6%. Many buyers grew used to these low borrowing costs. Now that rates are back above 7%, owning a home has become noticeably more expensive.
One major result is what economists call the “lock-in” effect. Homeowners who locked in low rates in prior years have little reason to sell, since moving would mean taking on a new loan at today’s much higher rate. This keeps fewer homes available for sale, which slows down the market. Washington policymakers are even looking at ideas like “portable mortgages,” which would let homeowners bring their lower rate with them when they move.
According to the National Association of Realtors, existing home sales fell 2.0% month-over-month and 1.2% year-over-year in August, reflecting continued softness in market activity.2 The inventory of existing homes now stands at 4.9 months of supply, and new homes now stand at 8.5 months, the highest levels in over a decade.3 For buyers who do enter the market, higher rates mean a bigger share of monthly income goes toward mortgage payments, which makes it harder to afford a home.
Home prices remain near record highs despite slow sales
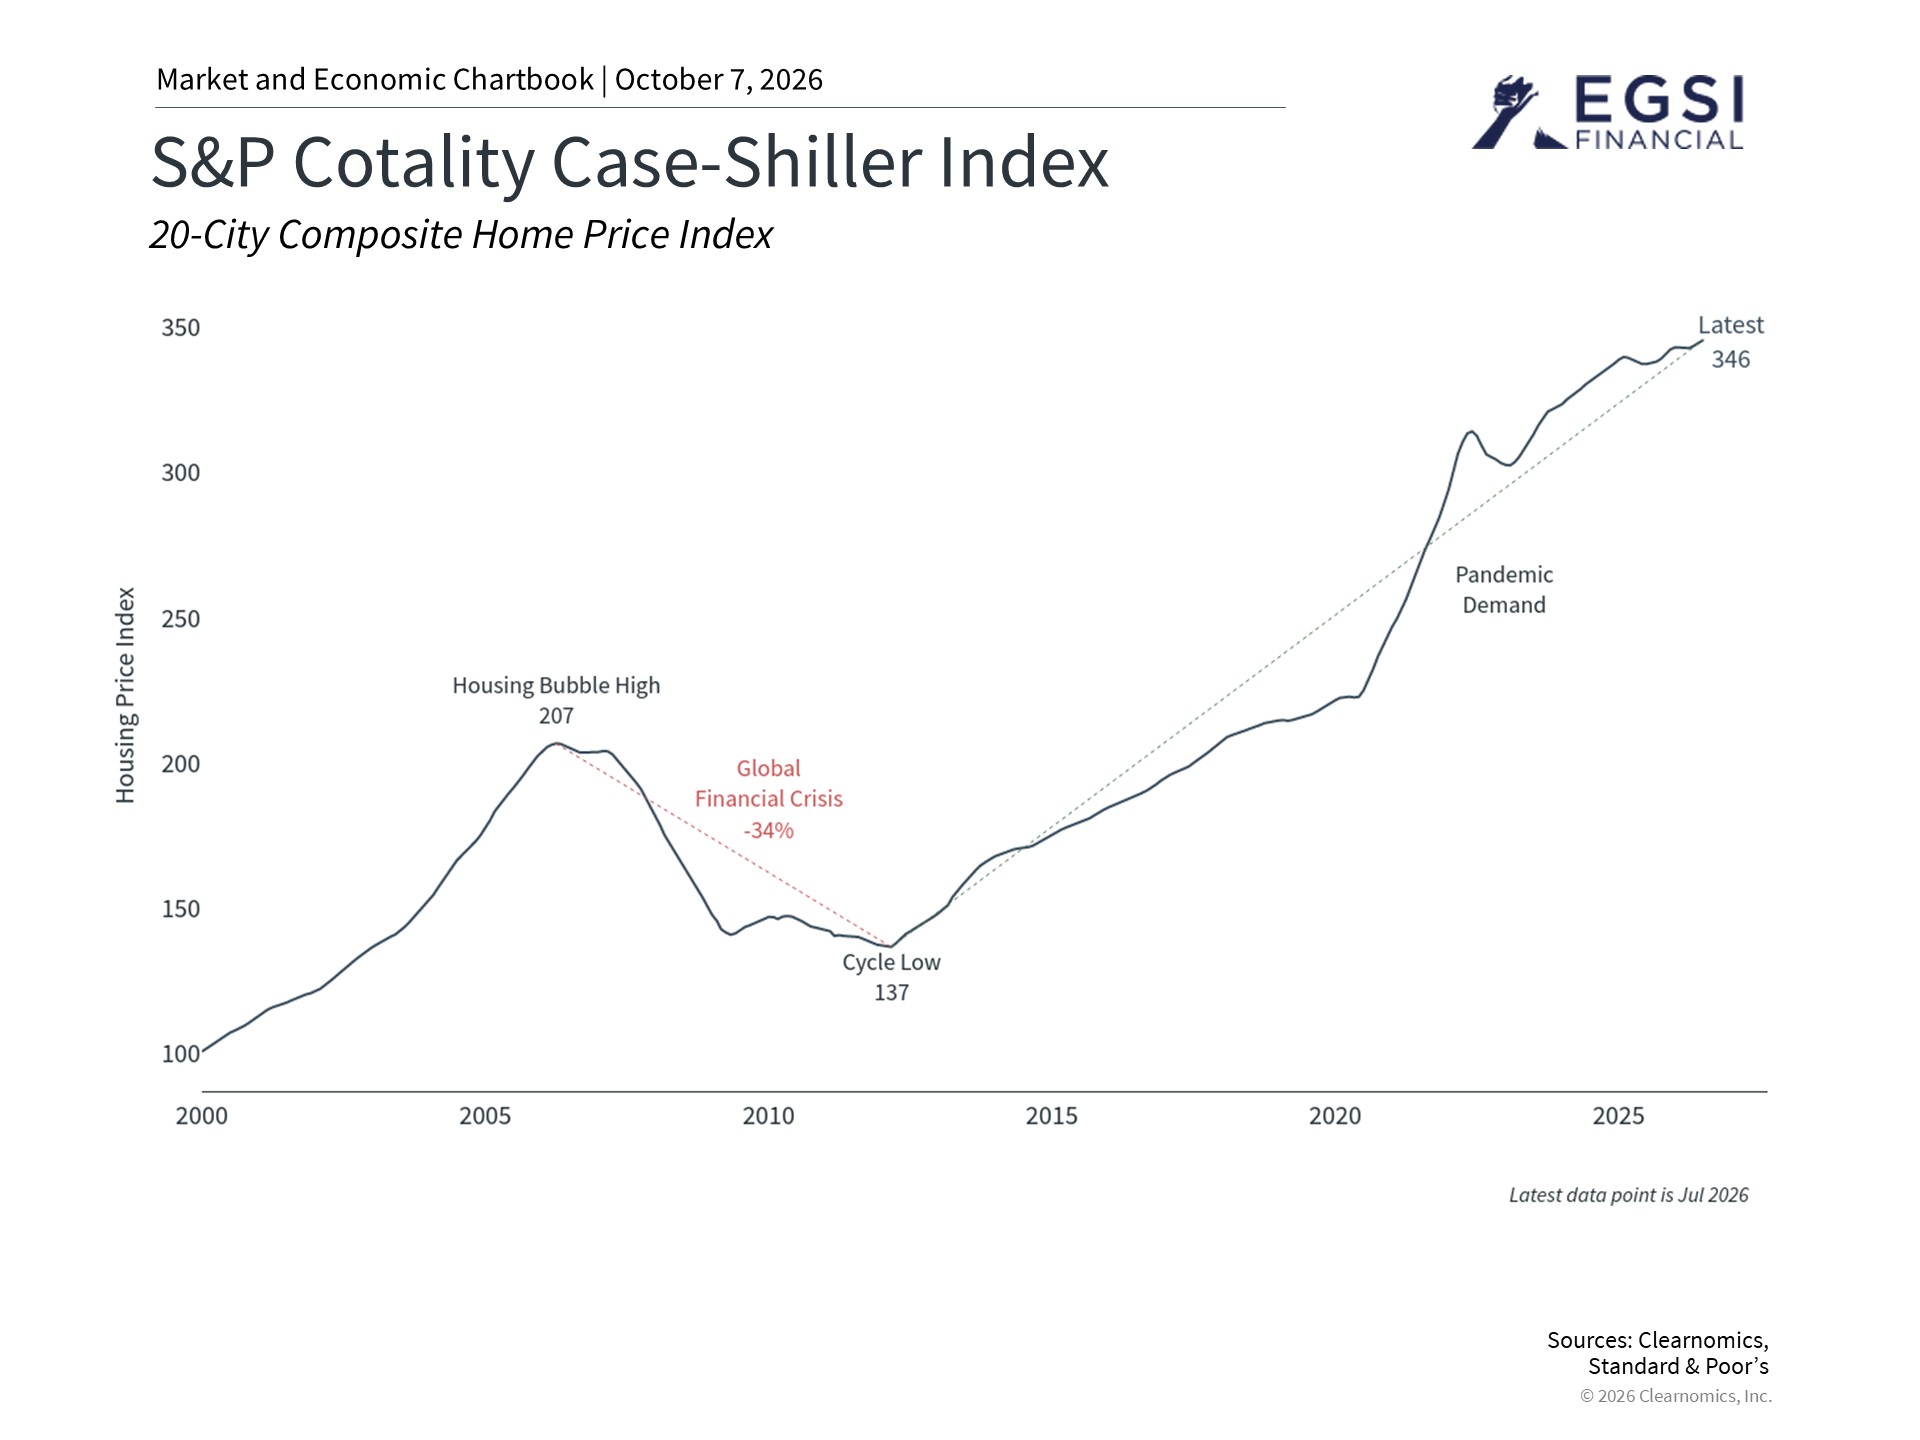
Even though fewer homes are being bought and sold, home prices across the country remain near all-time highs according to the S&P Cotality Case-Shiller Index, as shown in the chart above. The economy is still healthy and unemployment is low, which means most homeowners can keep up with their mortgage payments and do not feel pressure to sell.
High home values contribute to what is known as the “wealth effect.” When people feel their home is worth more, they tend to feel more financially secure and may spend more. This, combined with a stock market near record levels, has helped keep consumer spending stronger than many expected. One puzzle over the past several years has been the disconnect between how consumers say they feel about the economy, versus how much they spend.4
One explanation is that sentiment is fueled more by inflation, driven by factors such as higher gasoline prices this year, while spending is fueled by the wealth effect. While housing costs are an important part of household finances, making up more than one-third of the Consumer Price Index (a common measure of inflation), these “shelter” costs have increased 3% over the past year while gasoline prices have jumped 27.4%.5
Refinancing activity has dropped sharply
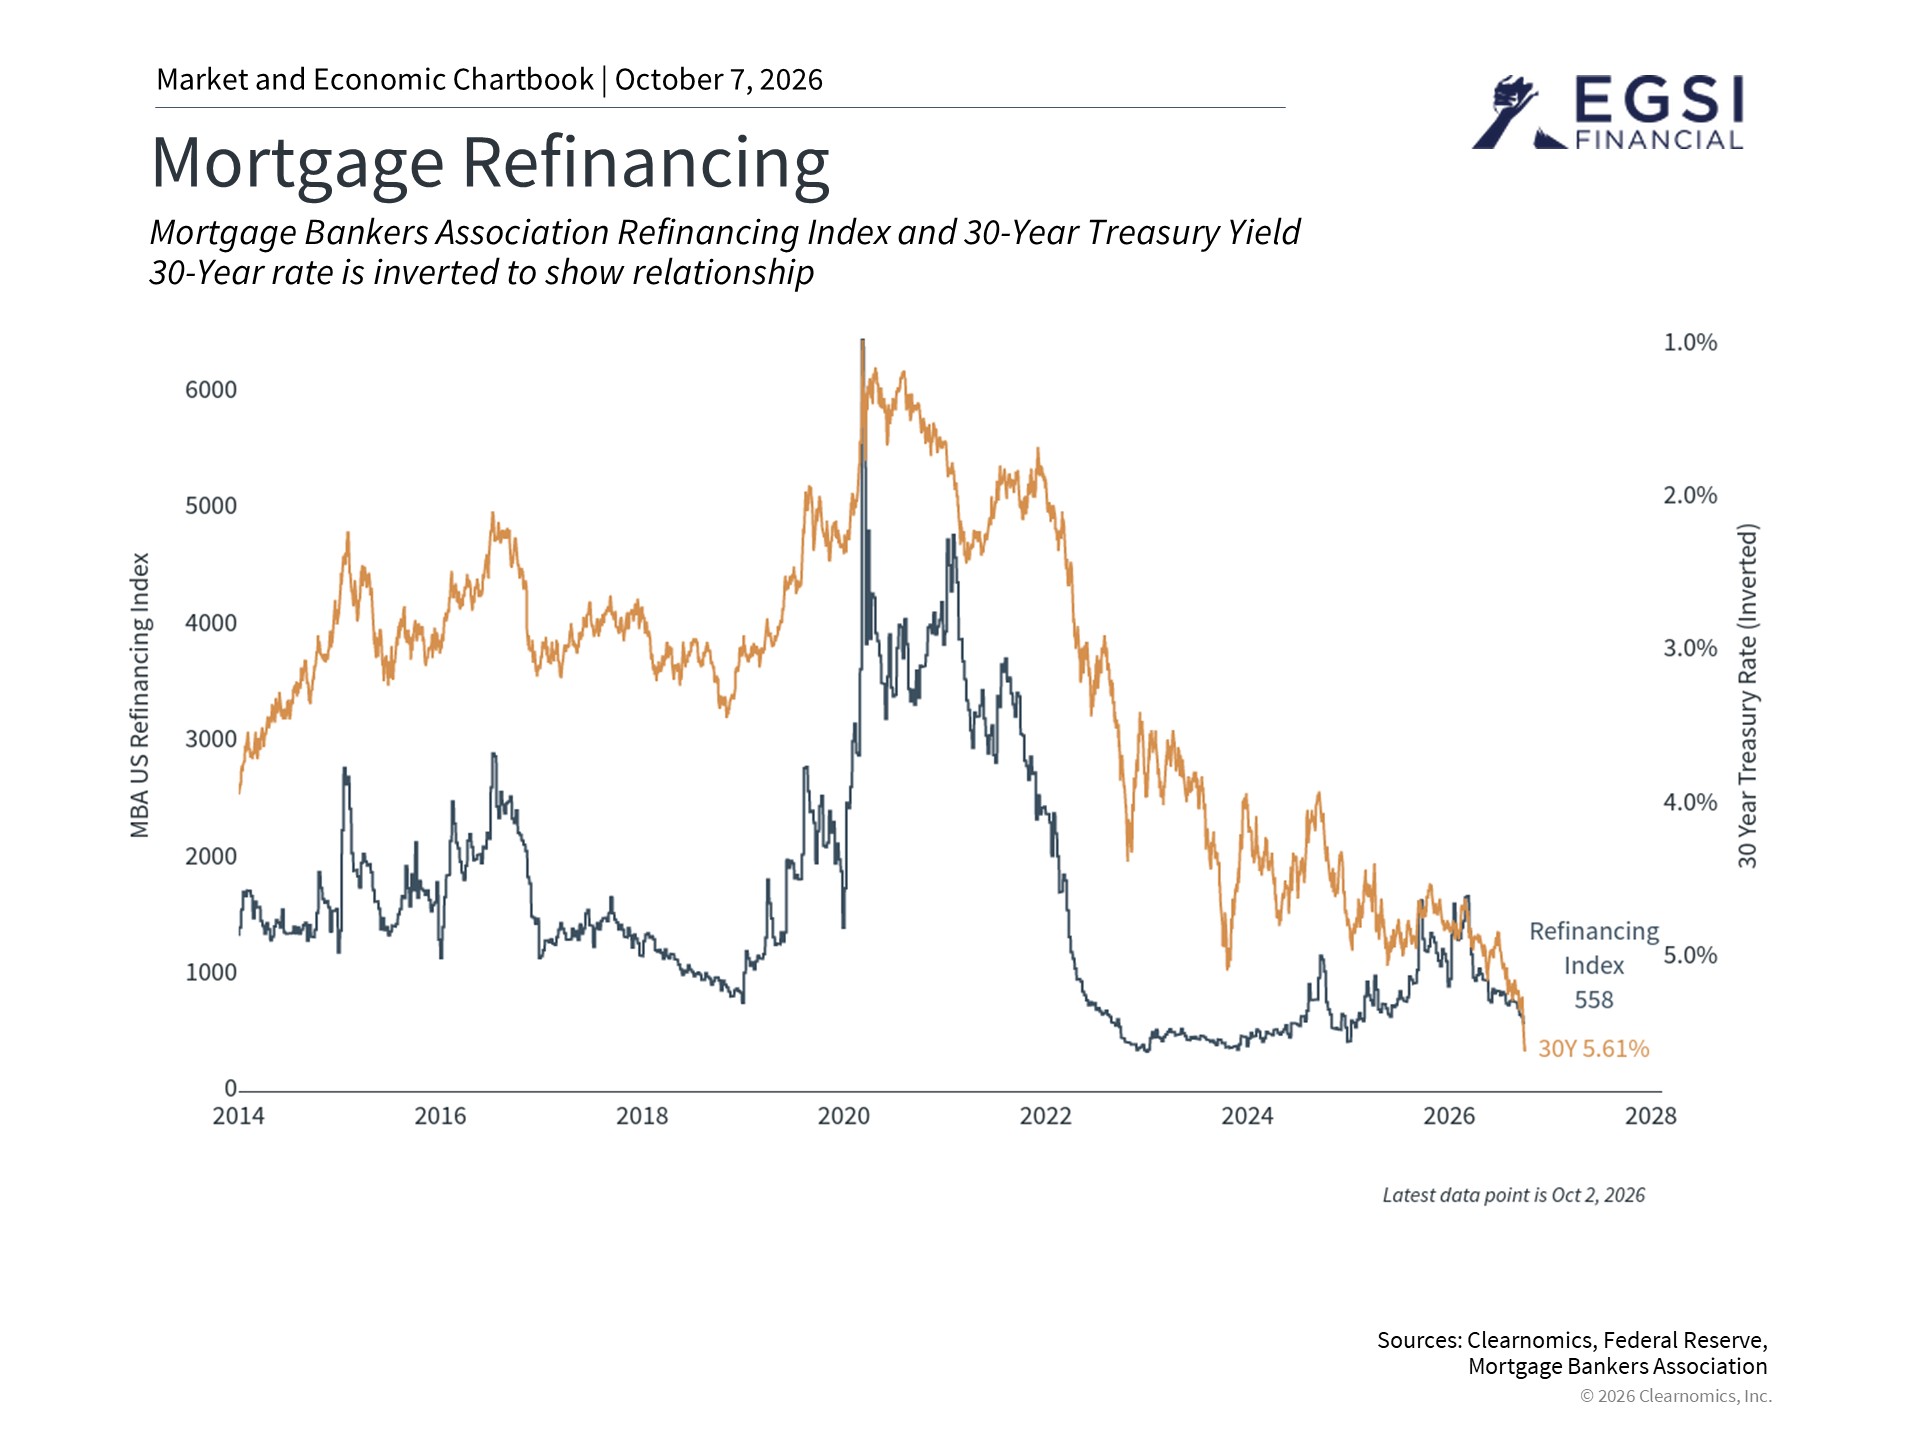
Refinancing (replacing an existing loan with a new one, often to get a lower rate) has fallen sharply. Data from the Mortgage Bankers Association shows that refinancing volumes have declined to multi-year lows after peaking from 2020 to 2022, when many homeowners took advantage of historically low rates to reduce their monthly payments or access home equity.6 Since refinancing can be a way for homeowners to turn rising home values into cash they can spend, this decline could weigh on consumer spending going forward.
Household debt service as a share of disposable income, which includes both mortgage and consumer debt, stood at approximately 11% in the second quarter of this year. This is still moderate relative to the pre-2008 peak of nearly 16%, suggesting that most households are managing their debt, even if they can’t access their equity.7 Many interest rates across maturities are near twenty-year highs, including 5-year, 10-year, and 30-year Treasury yields.8 The Fed’s own quarterly Summary of Economic Projections also suggests that policy rates could stay elevated through at least 2027.9 For both investors and homeowners, staying disciplined and focused on long-term financial plans remains the best approach.
The bottom line? The housing market may continue to be affected by rising interest rates as mortgage rates jump past 7%. For investors, this period of higher rates requires staying vigilant and focusing on long-term planning.
References
1. https://www.nahb.org/news-and-economics/housing-economics/housings-economic-impact/housings-contribution-to-gross-domestic-product
2. https://www.nar.realtor/newsroom/nar-existing-home-sales-report-shows-2-0-decrease-in-august
3. https://www.nar.realtor/research-and-statistics/housing-statistics/existing-home-sales
4. https://www.sca.isr.umich.edu/
5. https://www.bls.gov/news.release/cpi.nr0.htm
6. Clearnomics research and the Mortgage Bankers Association, as of September 28, 2026
7. Clearnomics research and the Federal Reserve Economic Data, as of September 28, 2026
8. https://home.treasury.gov/policy-issues/financing-the-government/interest-rate-statistics
9. https://www.federalreserve.gov/monetarypolicy/fomcprojtabl20260916.htm
Index Descriptions
S&P Cotality Case-Shiller Home Price Indices
The S&P Cotality Case-Shiller 20-City Index measures the value of residential real estate and tracks changes in the selling prices of single-family homes across 20 major U.S. metropolitan areas.
We are an independent financial services firm helping individuals create retirement strategies using a variety of investment and insurance products to custom suit their needs and objectives.
Advisory services offered through EGSI Investment Management, Inc., a Registered Investment Advisor with the State of Ohio. Insurance services offered through EGSI Financial, Inc.
Investing involves risk, including the potential loss of principal. No investment strategy can guarantee a profit or protect against loss in periods of declining values. None of the information contained on this website shall constitute an offer to sell or solicit any offer to buy a security or any insurance product.
Any references to protection benefits, safety, security, or steady and lifetime income streams on this website refer only to fixed insurance products. They do not refer, in any way, to securities or investment advisory products. Annuity guarantees are backed by the financial strength and claims-paying ability of the issuing insurance company. Annuities are insurance products that may be subject to fees, surrender charges and holding periods which vary by insurance company. Annuities are not FDIC insured.
The information and opinions contained in any of the material requested from this website are provided by third parties and have been obtained from sources believed to be reliable, but accuracy and completeness cannot be guaranteed. They are given for informational purposes only and are not a solicitation to buy or sell any of the products mentioned. The information is not intended to be used as the sole basis for financial decisions, nor should it be construed as advice designed to meet the particular needs of an individual’s situation.