

With midterm election season underway, many investors are watching closely to see how the results could affect which party controls Congress. Current forecasts point to a divided government as the most likely outcome, given that Republicans currently hold slim majorities in both the House and Senate.1 A shift in party control would mark a change from the past two years, but this kind of outcome is actually quite common during midterm cycles.
While no one can predict election results with certainty, one clear development is that the federal budget deficit grew to just under $2 trillion over the past year. This is the highest level in absolute terms since 2021.2 In simple terms, the government spent far more money than it took in. This imbalance is likely to continue no matter which party wins control of Congress, because long-standing challenges such as rising interest costs and large entitlement programs (like Social Security and Medicare) have built up over many decades. The result is a growing national debt, which has now surpassed $40 trillion, or more than 120% of the total size of the U.S. economy.3
For investors who follow these headlines, it is natural to feel worried, regardless of political views. That is precisely why it helps to keep a long-term perspective and to separate political issues from investment and financial planning decisions. So, what should investors understand about the budget deficit and the upcoming election?
The federal budget deficit has been growing in recent years
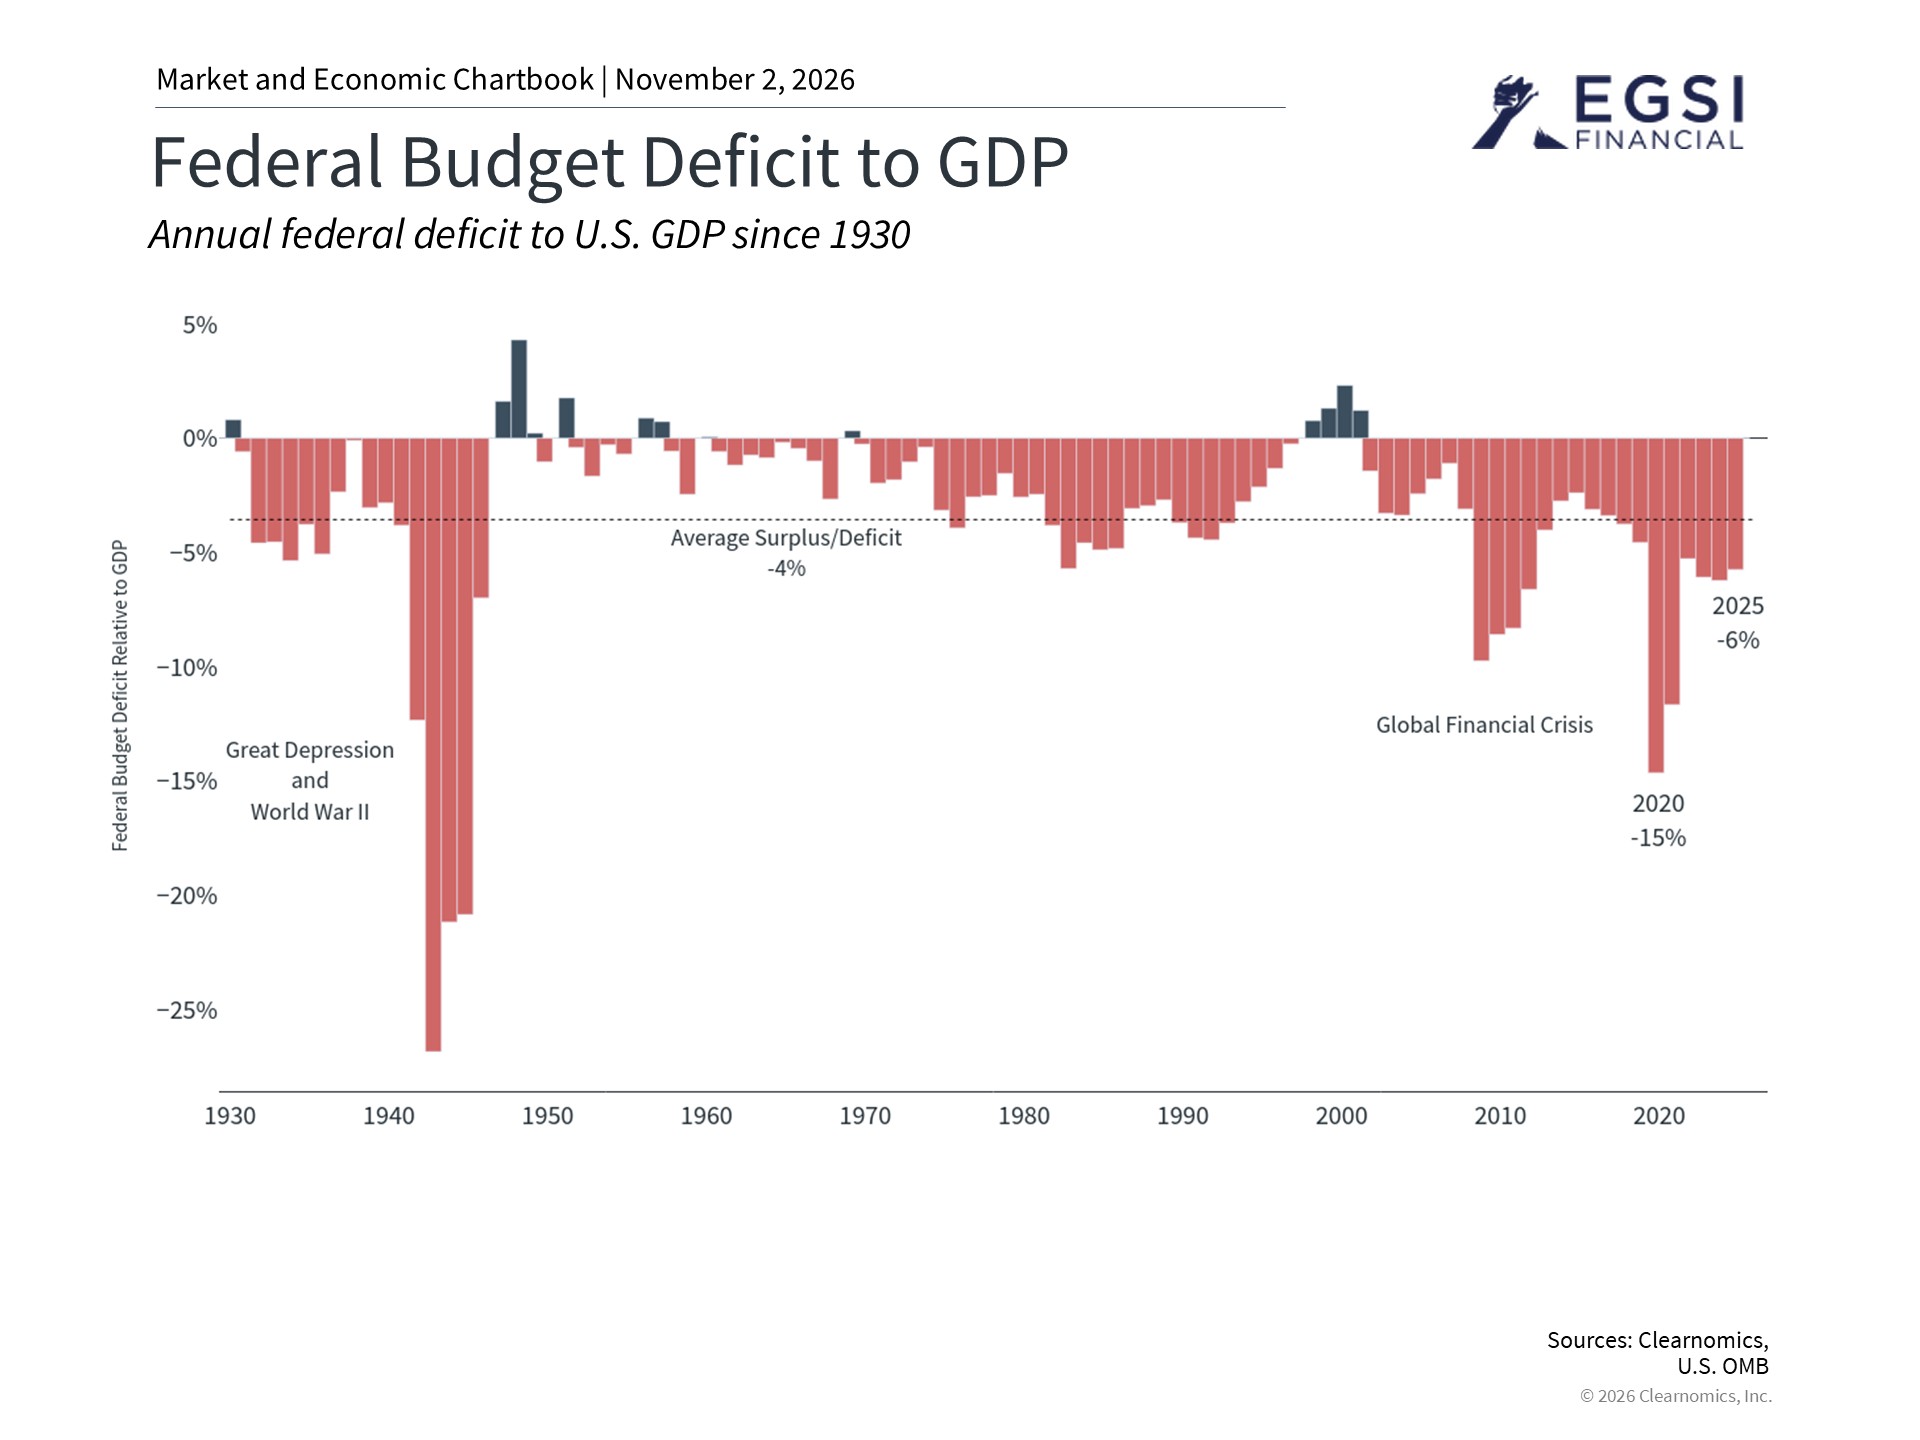
To understand how government spending affects financial markets, it helps to start with the basic numbers. For the fiscal year that ended September 30, 2026, the federal government recorded a deficit of $1.99 trillion. That is a 12% increase from the $1.78 trillion deficit recorded the year before.4 The government spent $7.4 trillion in total but only collected $5.4 trillion through taxes, tariffs, and other sources of revenue.5
The government covers this gap by borrowing money, which it does by issuing Treasury securities. These are essentially loans that investors and institutions around the world purchase. Based on current Gross Domestic Product (GDP) figures, which measure the total size of the economy, the latest deficit is likely to represent around 6% of GDP. This is similar to the ratio seen in 2025.6
The chart above shows that recent deficits have been large compared to historical norms. Over nearly a century, the budget deficit has averaged about 4% of GDP. Periods of major financial stress or global disruption have caused even wider gaps, such as during World War II and the 2008 global financial crisis.
Deficits have generally shrunk after these kinds of events, but true budget surpluses (where the government takes in more than it spends) have been rare. The last time the budget was balanced was during the Clinton administration, supported by a strong decade of economic growth. Before that, surpluses appeared during the Johnson and Eisenhower administrations in the late 1960s and mid-1950s, respectively.
Each year’s deficit adds to the total national debt, which crossed $40 trillion for the first time in August. According to the Congressional Joint Economic Committee, this works out to roughly $117,707 per American, or $298,606 per household.7
Although these numbers are large and represent real fiscal challenges, it can be difficult to know what to do with this information as an investor. History suggests that adjusting a portfolio based on deficit concerns would often have worked against long-term financial goals. This is because deficits tend to be largest during times of economic and financial stress, which are also typically the times when markets are near their lowest points. In other words, those periods would actually have been some of the best times to invest.
Debt ceiling deadlines and rising interest rates are worth watching
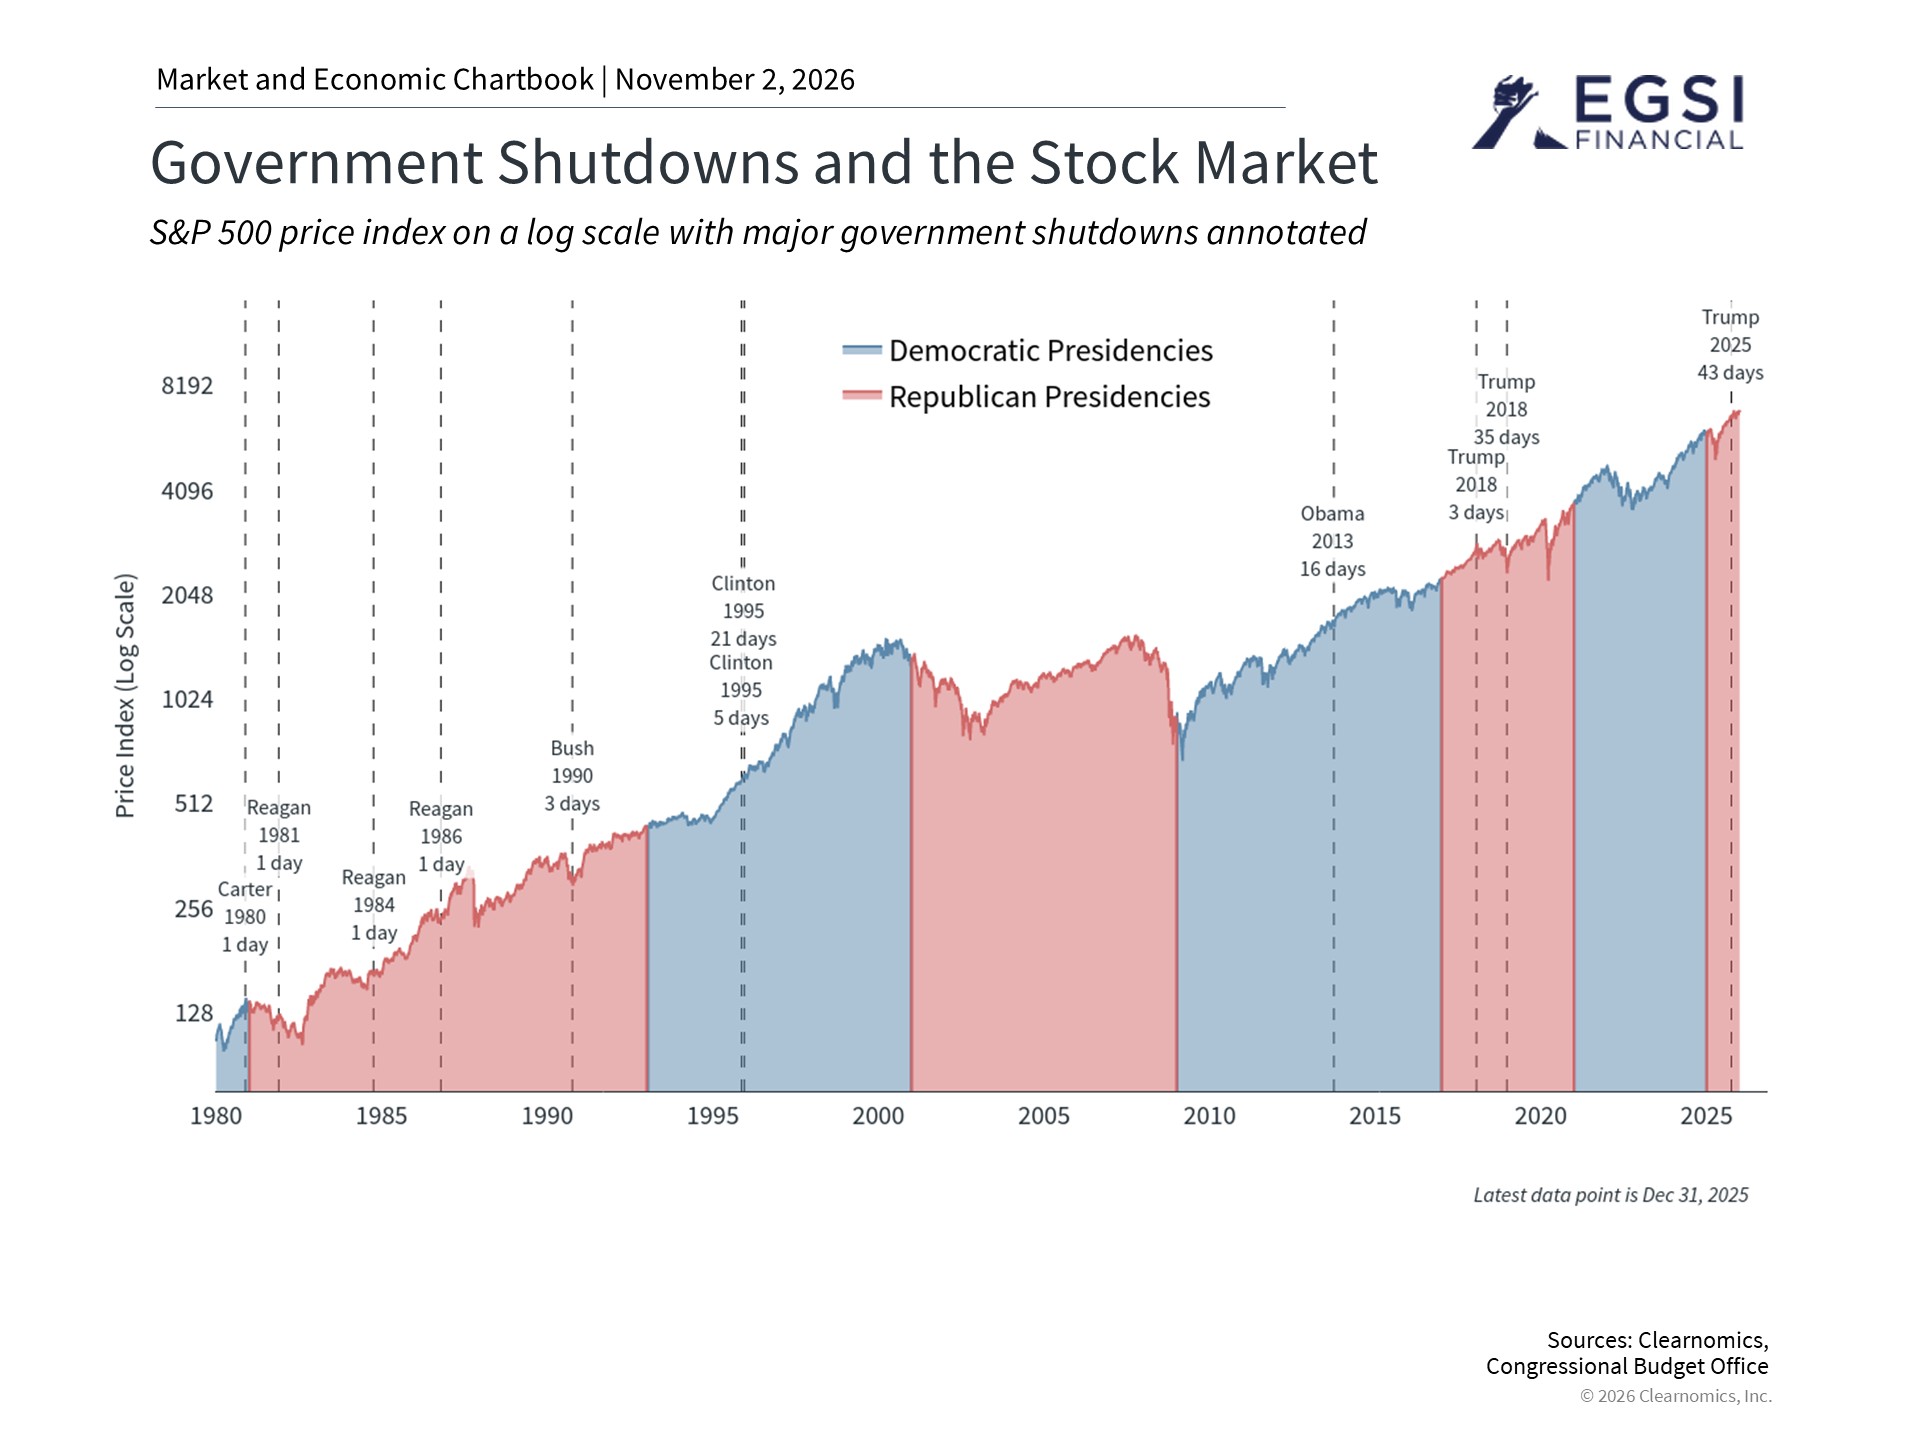
There are two specific issues that long-term investors should keep in mind. First, the national debt is getting close to the legal borrowing limit, known as the debt ceiling, which was set at $41.1 trillion by the One Big Beautiful Bill Act last year. That limit could be reached by mid-2027.8 Separately, the federal government faces a budget deadline of December 11, which falls shortly after the midterm election. Raising the debt ceiling is expected to be one of the central debates for the incoming Congress. If an agreement is not reached in time, the result could be a government shutdown.
Government shutdowns can cause hardship for federal workers and trigger short-term swings in financial markets. However, major market indexes have historically stabilized fairly quickly and moved past these events. This was true even during some of the longest shutdowns on record, including those in 2018 and more recently in 2025. The chart above shows past government shutdowns alongside the stock market’s overall upward trend during that time. While past performance does not guarantee future results, this history does highlight why it is important not to overreact to political news when making investment decisions.
Second, rising interest rates are making the government’s fiscal situation more difficult. The 30-year Treasury yield, which is the interest rate on long-term government bonds, has stayed above 5% since June, and the 10-year yield remains near that level as well. This matters because as older government debt matures and needs to be repaid, the government must borrow again at these higher rates. That increases the government’s interest payments and makes the budget imbalance worse. This is one reason the Treasury Department has stepped in to purchase Treasury securities to help keep U.S. interest rates stable.9 The Treasury has also taken other steps, such as supporting the Japanese yen, to help stabilize rates indirectly.
Policy uncertainty can cause short-term market swings
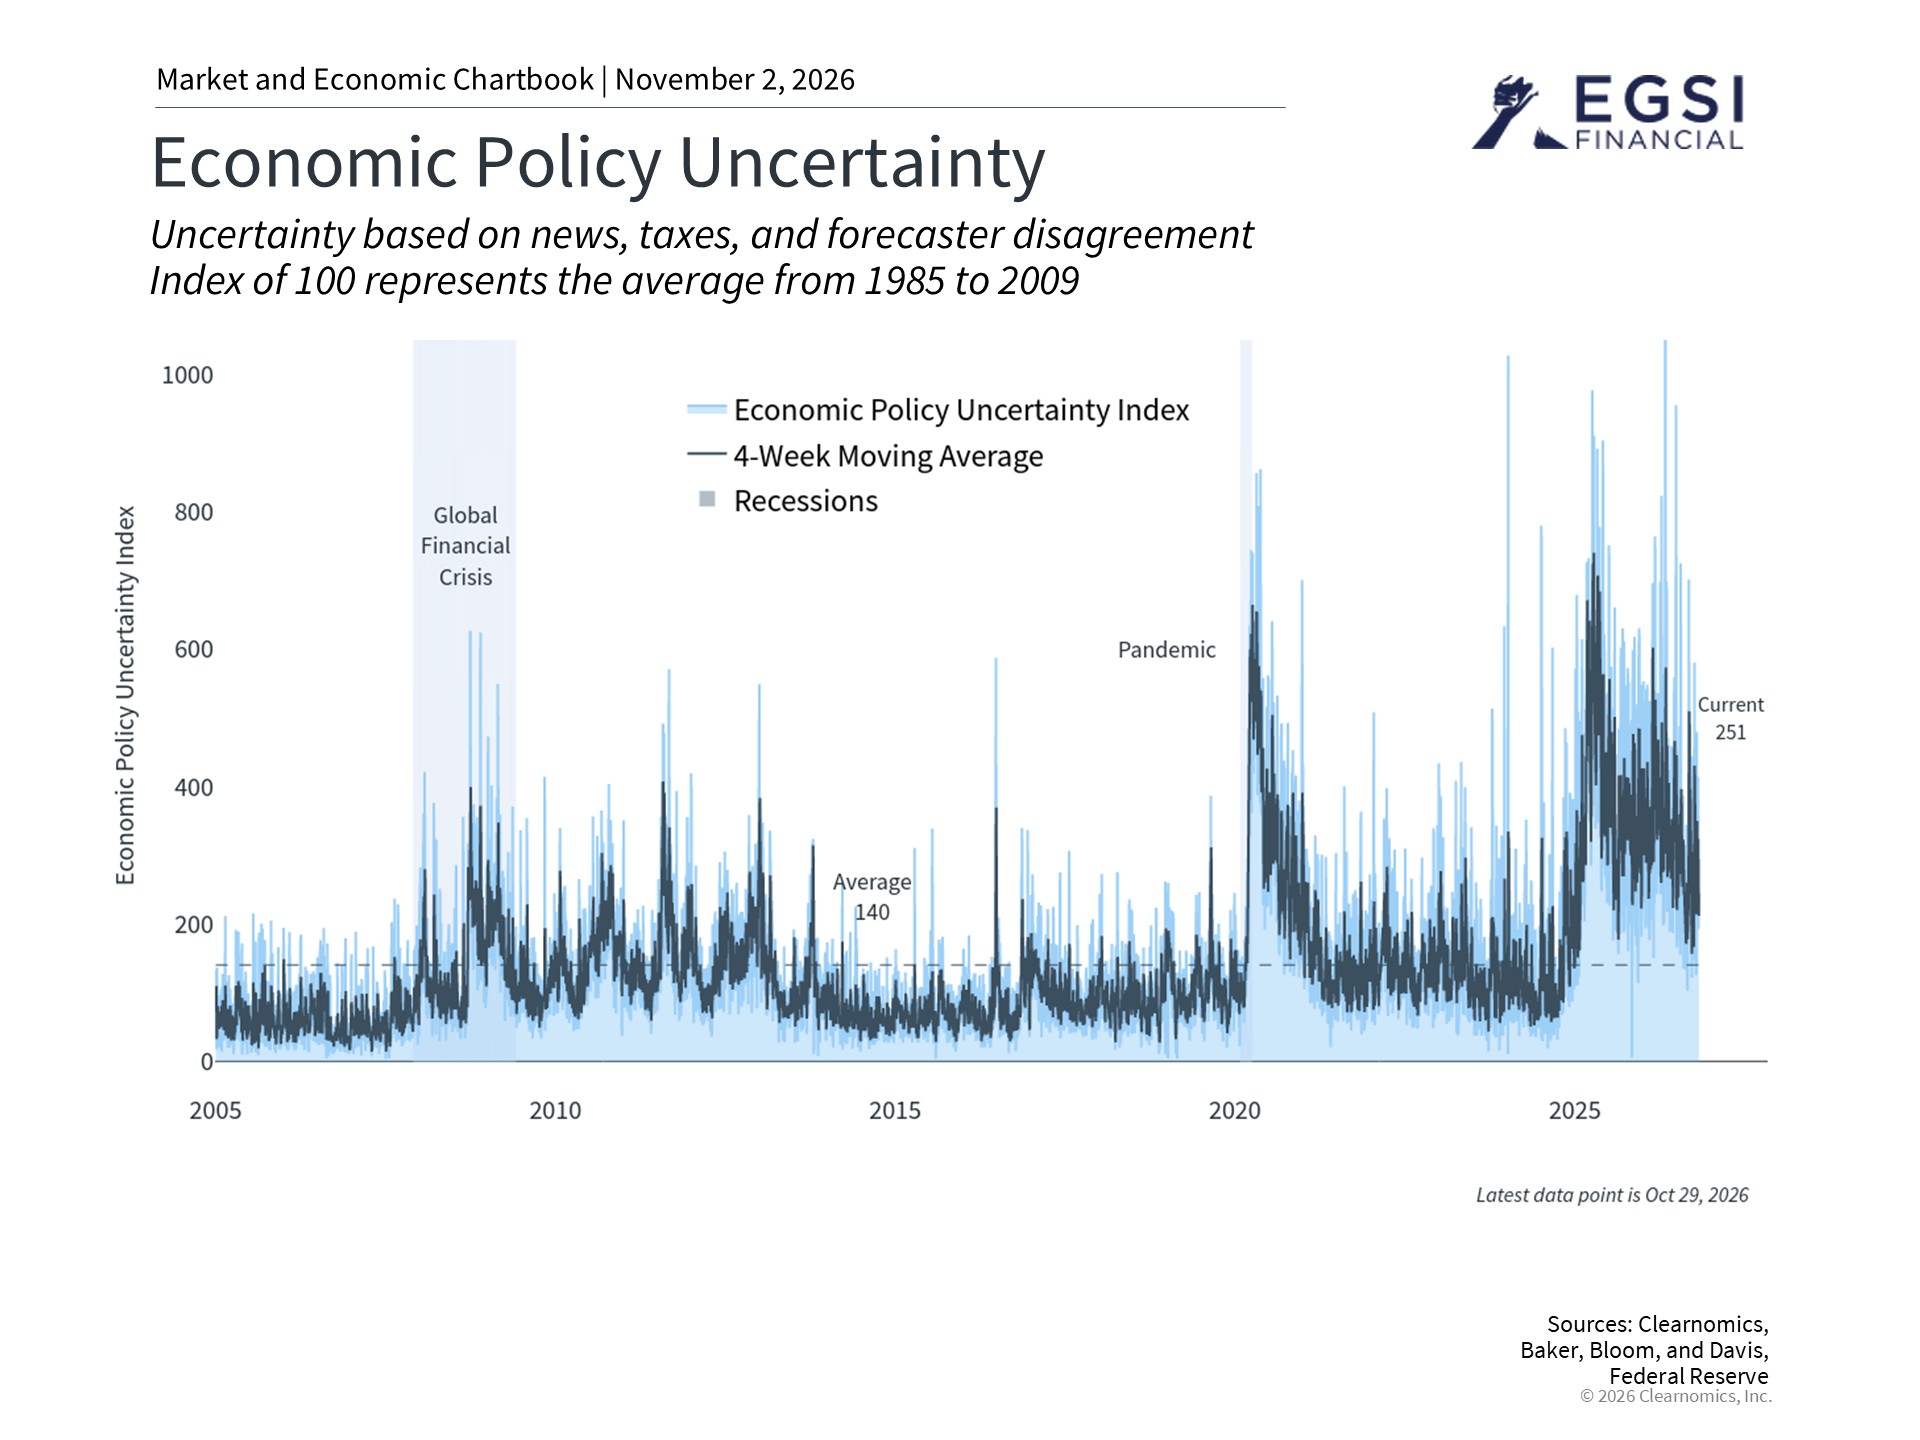
The national debt is a long-term challenge with no easy answers, since addressing it requires difficult decisions about taxes, spending, and programs like Social Security and Medicare. At the same time, predictions about policy outcomes are often wrong, especially when the economy is growing strongly. For example, the market drop that followed last year’s tariff announcements turned out to be shorter than many had expected, and markets rebounded to reach new all-time highs.
This is why staying level-headed about political topics is so important for investors. The chart above shows that uncertainty around economic policy has contributed to short-term market volatility in recent years, but these periods have typically not lasted long. Earlier episodes, including geopolitical conflict in the Middle East this year, caused turbulence as investors tried to gauge the impact on the economy and corporate profits. Although oil prices remain elevated, markets have performed well overall, supported by healthy underlying economic trends.
None of this is meant to suggest that every year will be positive, that the national debt is not a real concern, or that policy does not matter. Rather, the key point is that factors such as corporate earnings (the profits companies make), interest rates, and longer-term economic trends tend to be the main drivers of market performance over time. For investors, making sound decisions based on these longer-term fundamentals is more important than reacting to political headlines or tracking which party controls Congress.
The bottom line? The midterm election and the growing federal deficit are important topics, but history shows that long-term portfolio outcomes are driven by fundamentals rather than by political outcomes.
References
1. https://www.realclearpolling.com/latest-polls
2. https://fiscaldata.treasury.gov/americas-finance-guide/national-deficit/
3. https://fiscaldata.treasury.gov/americas-finance-guide/national-debt/
4. https://fiscaldata.treasury.gov/americas-finance-guide/national-debt/
5. https://www.realclearpolling.com/latest-polls
6. Clearnomics research using U.S. Treasury and Bureau of Economic Analysis data, as of October 23, 2026
7. https://www.jec.senate.gov/public/index.cfm/republicans/debt-dashboard
8. Clearnomics research and U.S. Treasury data, as of October 23, 2026
9. https://home.treasury.gov/news/press-releases/sb0607
Index Descriptions
S&P 500
The Standard & Poor’s 500 Index is a capitalization-weighted index of 500 stocks designed to measure performance of the broad domestic economy through changes in the aggregate market value of 500 stocks representing all major industries.
We are an independent financial services firm helping individuals create retirement strategies using a variety of investment and insurance products to custom suit their needs and objectives.
Advisory services offered through EGSI Investment Management, Inc., a Registered Investment Advisor with the State of Ohio. Insurance services offered through EGSI Financial, Inc.
Investing involves risk, including the potential loss of principal. No investment strategy can guarantee a profit or protect against loss in periods of declining values. None of the information contained on this website shall constitute an offer to sell or solicit any offer to buy a security or any insurance product.
Any references to protection benefits, safety, security, or steady and lifetime income streams on this website refer only to fixed insurance products. They do not refer, in any way, to securities or investment advisory products. Annuity guarantees are backed by the financial strength and claims-paying ability of the issuing insurance company. Annuities are insurance products that may be subject to fees, surrender charges and holding periods which vary by insurance company. Annuities are not FDIC insured.
The information and opinions contained in any of the material requested from this website are provided by third parties and have been obtained from sources believed to be reliable, but accuracy and completeness cannot be guaranteed. They are given for informational purposes only and are not a solicitation to buy or sell any of the products mentioned. The information is not intended to be used as the sole basis for financial decisions, nor should it be construed as advice designed to meet the particular needs of an individual’s situation.