The first half of 2026 was anything but calm for investors. Major events, including the war in Iran, oil-driven inflation hitting multi-year highs, and questions about artificial intelligence (AI), all tested investor nerves. Yet markets climbed to new all-time highs, corporate earnings grew at a double-digit pace, and many types of investments performed well. The biggest lesson from the first six months: staying invested and keeping a long-term view matters.
The second half of the year will bring its own surprises, including developments in the Middle East conflict, the upcoming midterm election, and new company stock listings called initial public offerings (IPOs). Knowing how to keep perspective during these events is key.
Key market and economic highlights from the first half of 20261
• The S&P 500, Nasdaq, and Dow Jones Industrial Average returned 9.6%, 12.8%, and 8.9% year-to-date through the end of June, respectively. The second quarter was historically strong, with the S&P 500 returning 14.9%, the Nasdaq 21.4%, and the Dow 12.9%.
• The Bloomberg U.S. Aggregate Bond Index rose 0.6% year-to-date. The 10-year Treasury yield ended the second quarter at 4.47%, up from 4.17% at the start of the year.
• Developed market international stocks (MSCI EAFE) gained 7.7% and emerging market stocks (MSCI EM) returned 22.7% year-to-date, both in U.S. dollar terms.
• The Bloomberg Commodities Index rose 12.3% year-to-date, driven by a strong first quarter gain of 23.3%, offset by a decline of 8.9% in the second quarter.
• Brent crude oil peaked just under $120 per barrel in May before closing the quarter at $73 per barrel.
• Gold prices fell to $4,007 per ounce, while Bitcoin declined to a recent low of $58,633.
• Headline CPI (a common measure of inflation) rose 4.2% year-over-year in May, driven largely by energy prices. Core CPI, which leaves out food and energy, rose 2.9%.
• The Federal Reserve kept interest rates unchanged at 3.50% to 3.75% through the first half of the year. Kevin Warsh was sworn in as Fed Chair in May.
The current business cycle has now entered its seventh year
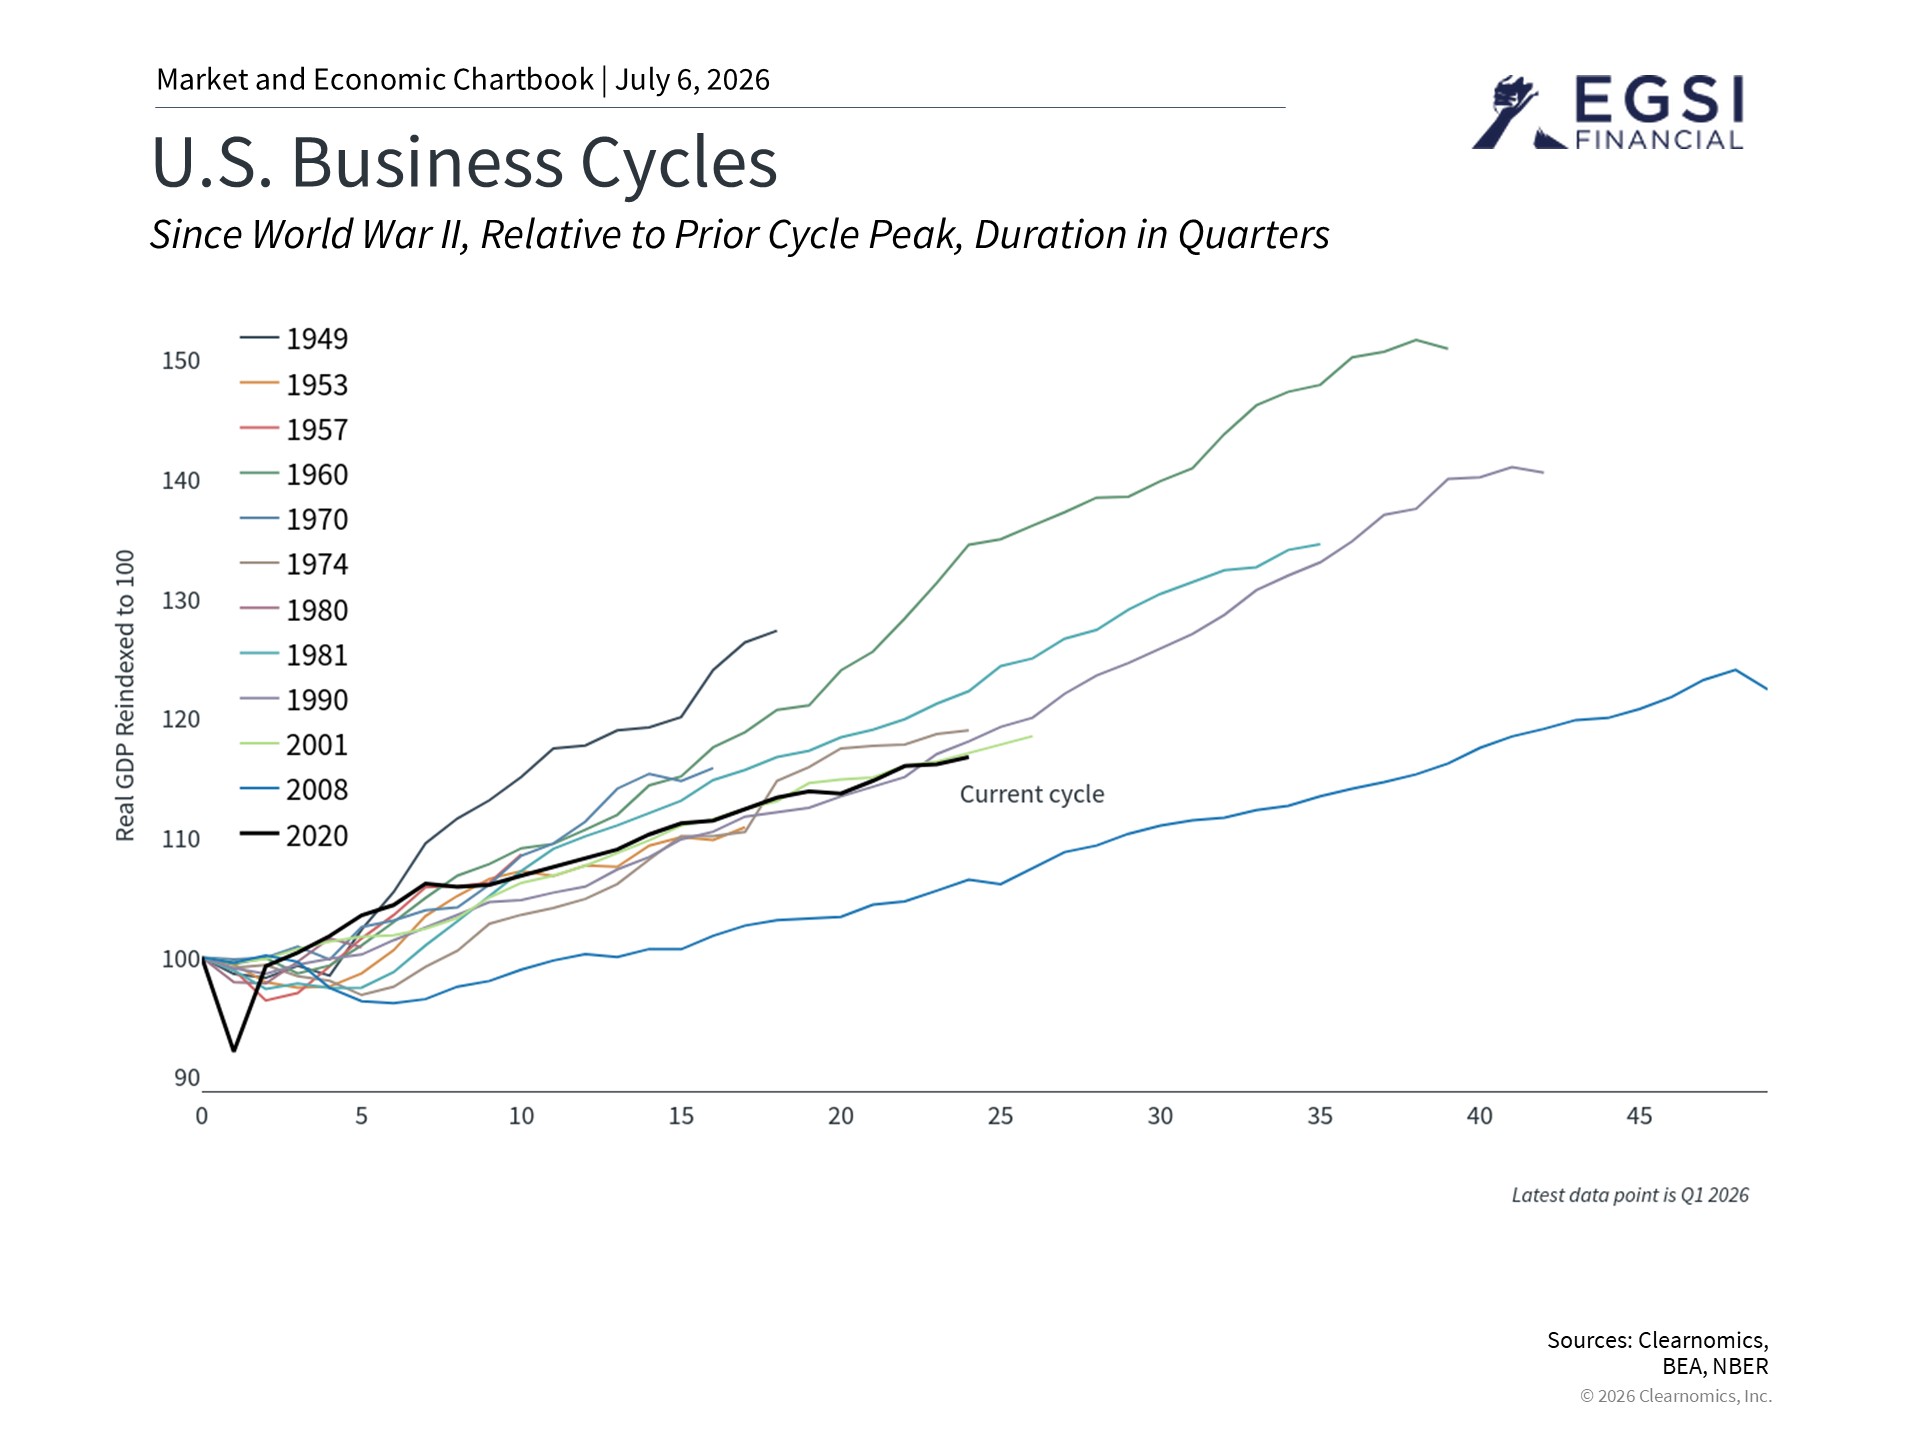
The current business cycle (the pattern of economic growth and slowdown) began in April 2020 during the pandemic and recently passed its sixth anniversary. There were moments when a recession seemed possible, including when inflation peaked in 2022 and when tariffs disrupted trade last year. Despite these challenges, the economy has kept growing.
Today, inflation remains elevated but may ease if oil prices stay low. The job market has picked up again, the dollar has stabilized, and business investment has increased. Consumers feel uncertain but continue to spend. Overall, the economy looks healthy, which has historically been good for financial markets over the long run.
Many different types of investments have done well this year
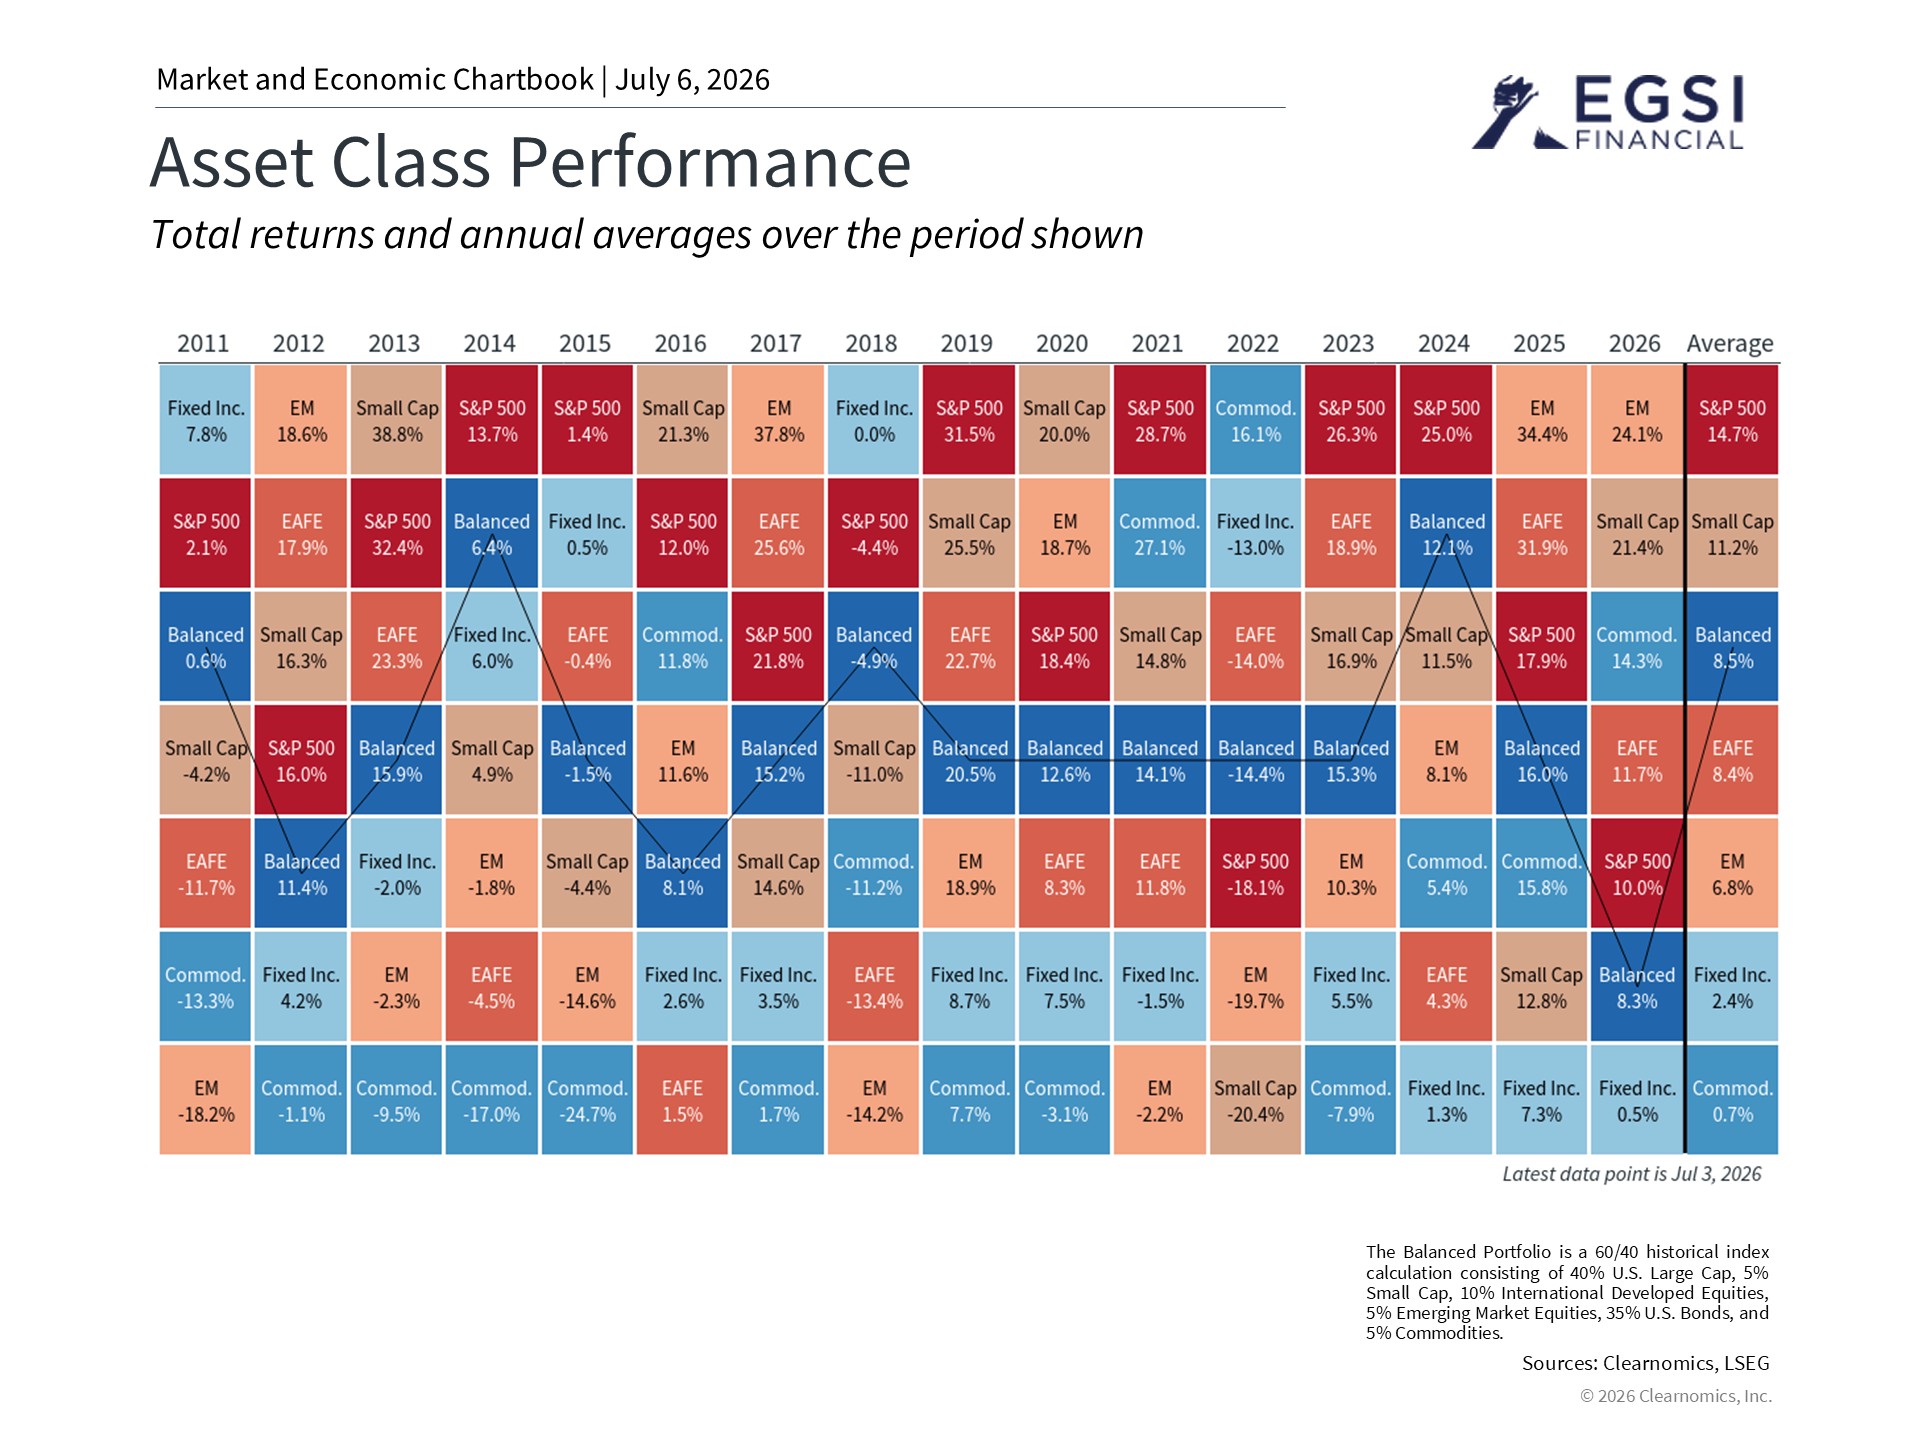
A wide range of investments have contributed to portfolio returns so far this year. This includes large company stocks, small company stocks, emerging market stocks, and commodities. Strong corporate earnings, optimism around AI, and hopes for peace in Iran have all played a role. Profits for S&P 500 companies have risen over 20% in the past twelve months.2
One thing to keep in mind: U.S. stock prices are historically high relative to earnings. The S&P 500 currently trades at a price-to-earnings (P/E) ratio of 20x, above the long-term average of 16x.3 While this does not predict short-term market moves, it is a useful reminder to maintain a balanced mix of investments across different asset classes.
Inflation remains elevated but energy prices have eased
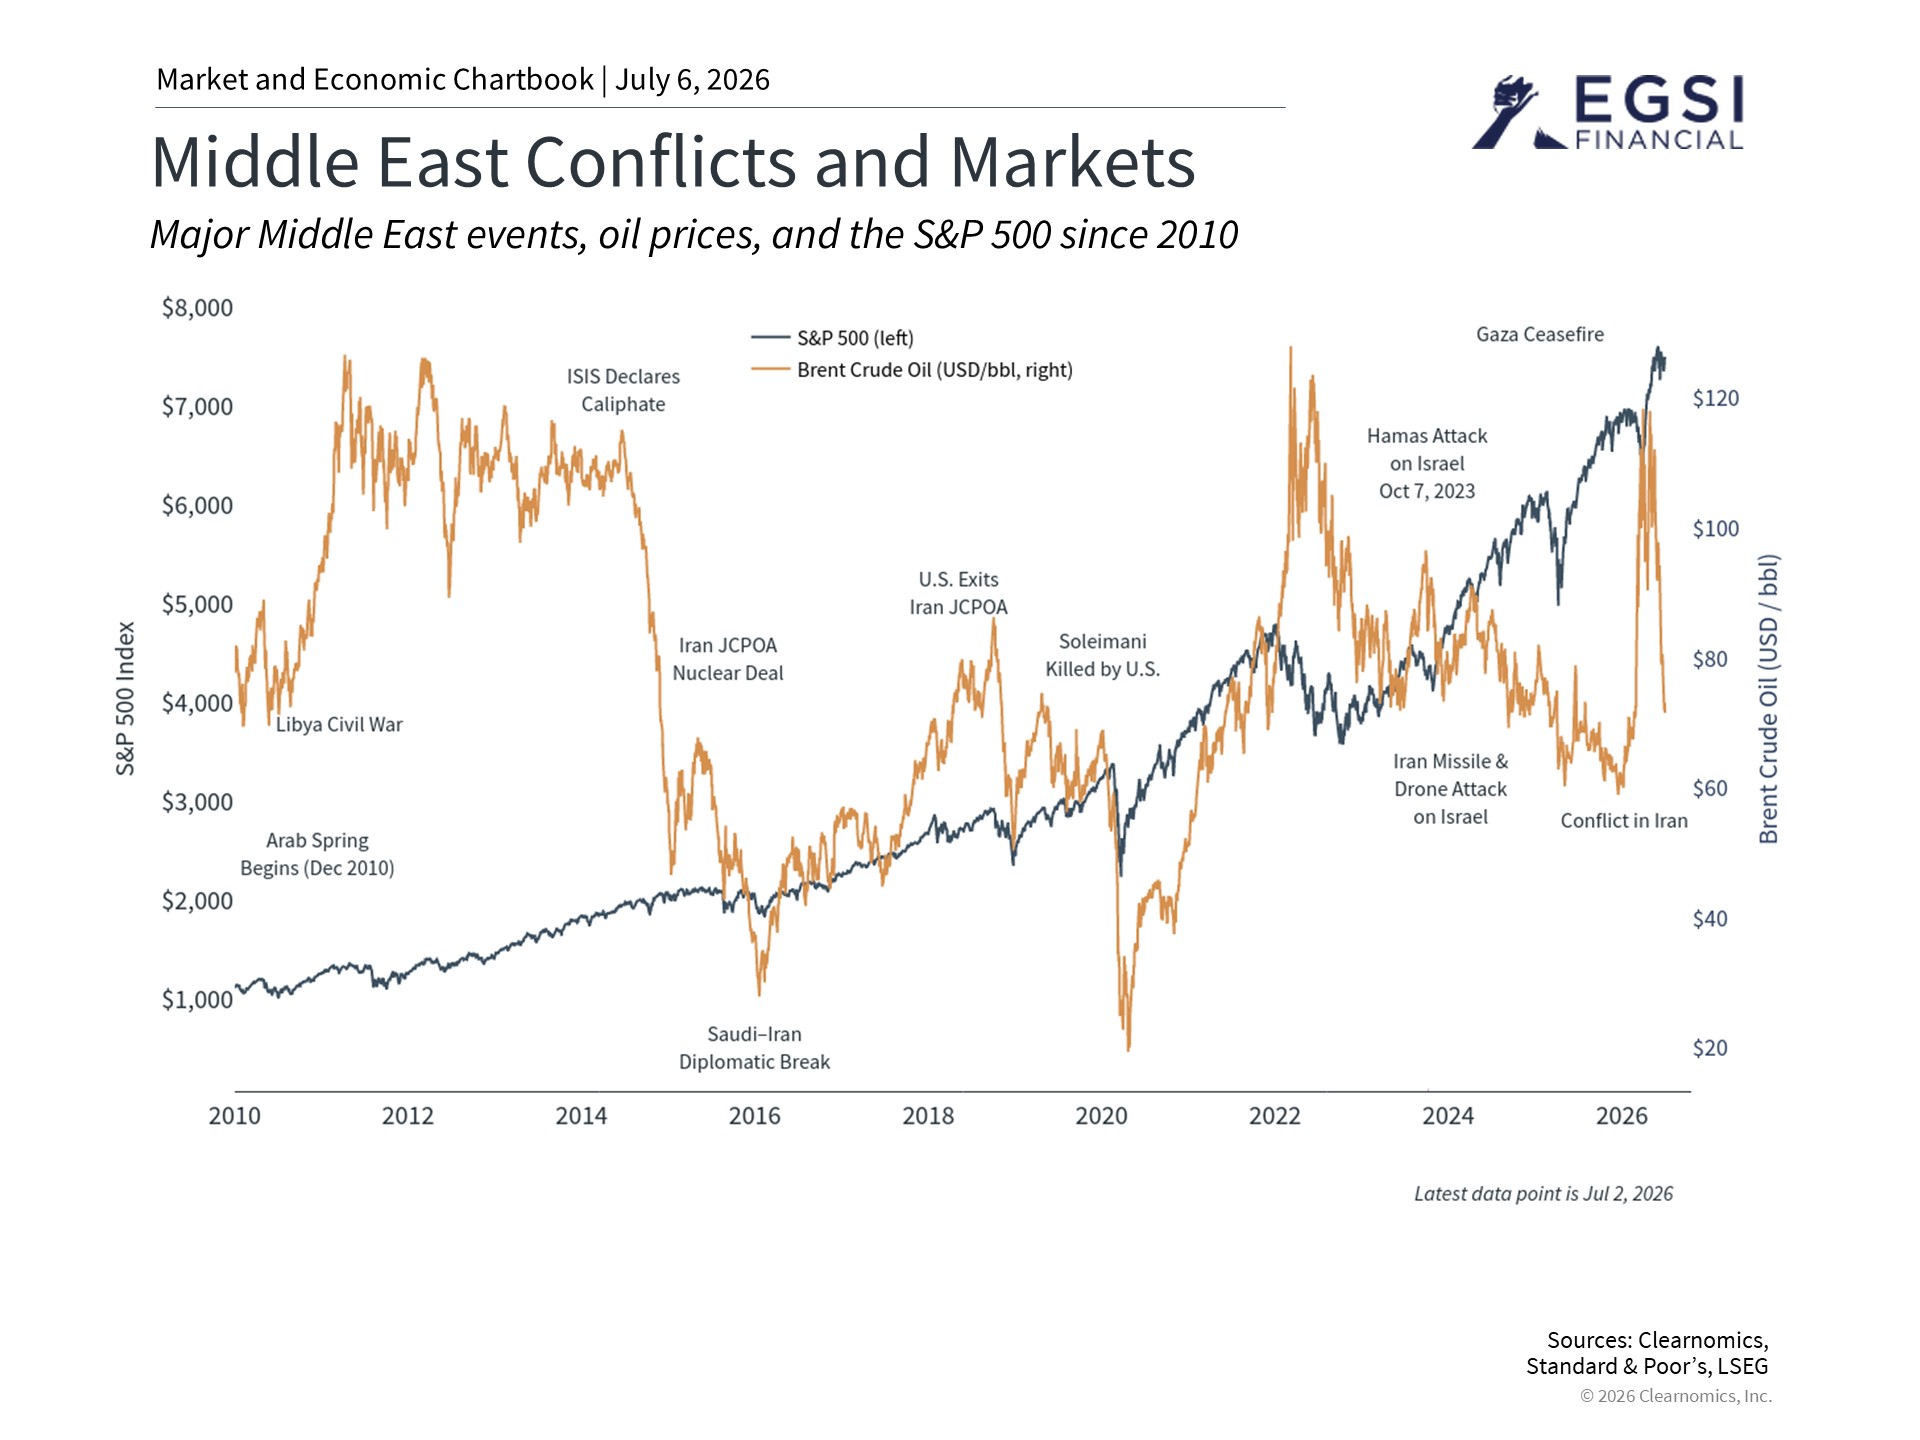
The conflict in Iran disrupted oil supplies, pushing Brent crude oil to nearly $120 per barrel before prices fell back to around $70 per barrel. Gasoline prices followed a similar path, peaking above $4.50 per gallon nationally before retreating below $4.00 per gallon.4 Overall inflation (CPI) rose 4.2% year-over-year in May, but core inflation, which removes food and energy, was only 2.9%.5 This suggests that inflation has been mostly driven by fuel costs rather than a broader trend. As oil prices ease, economists are hopeful that inflation will also come down, as has happened after past geopolitical shocks.
Market swings have stayed manageable so far this year
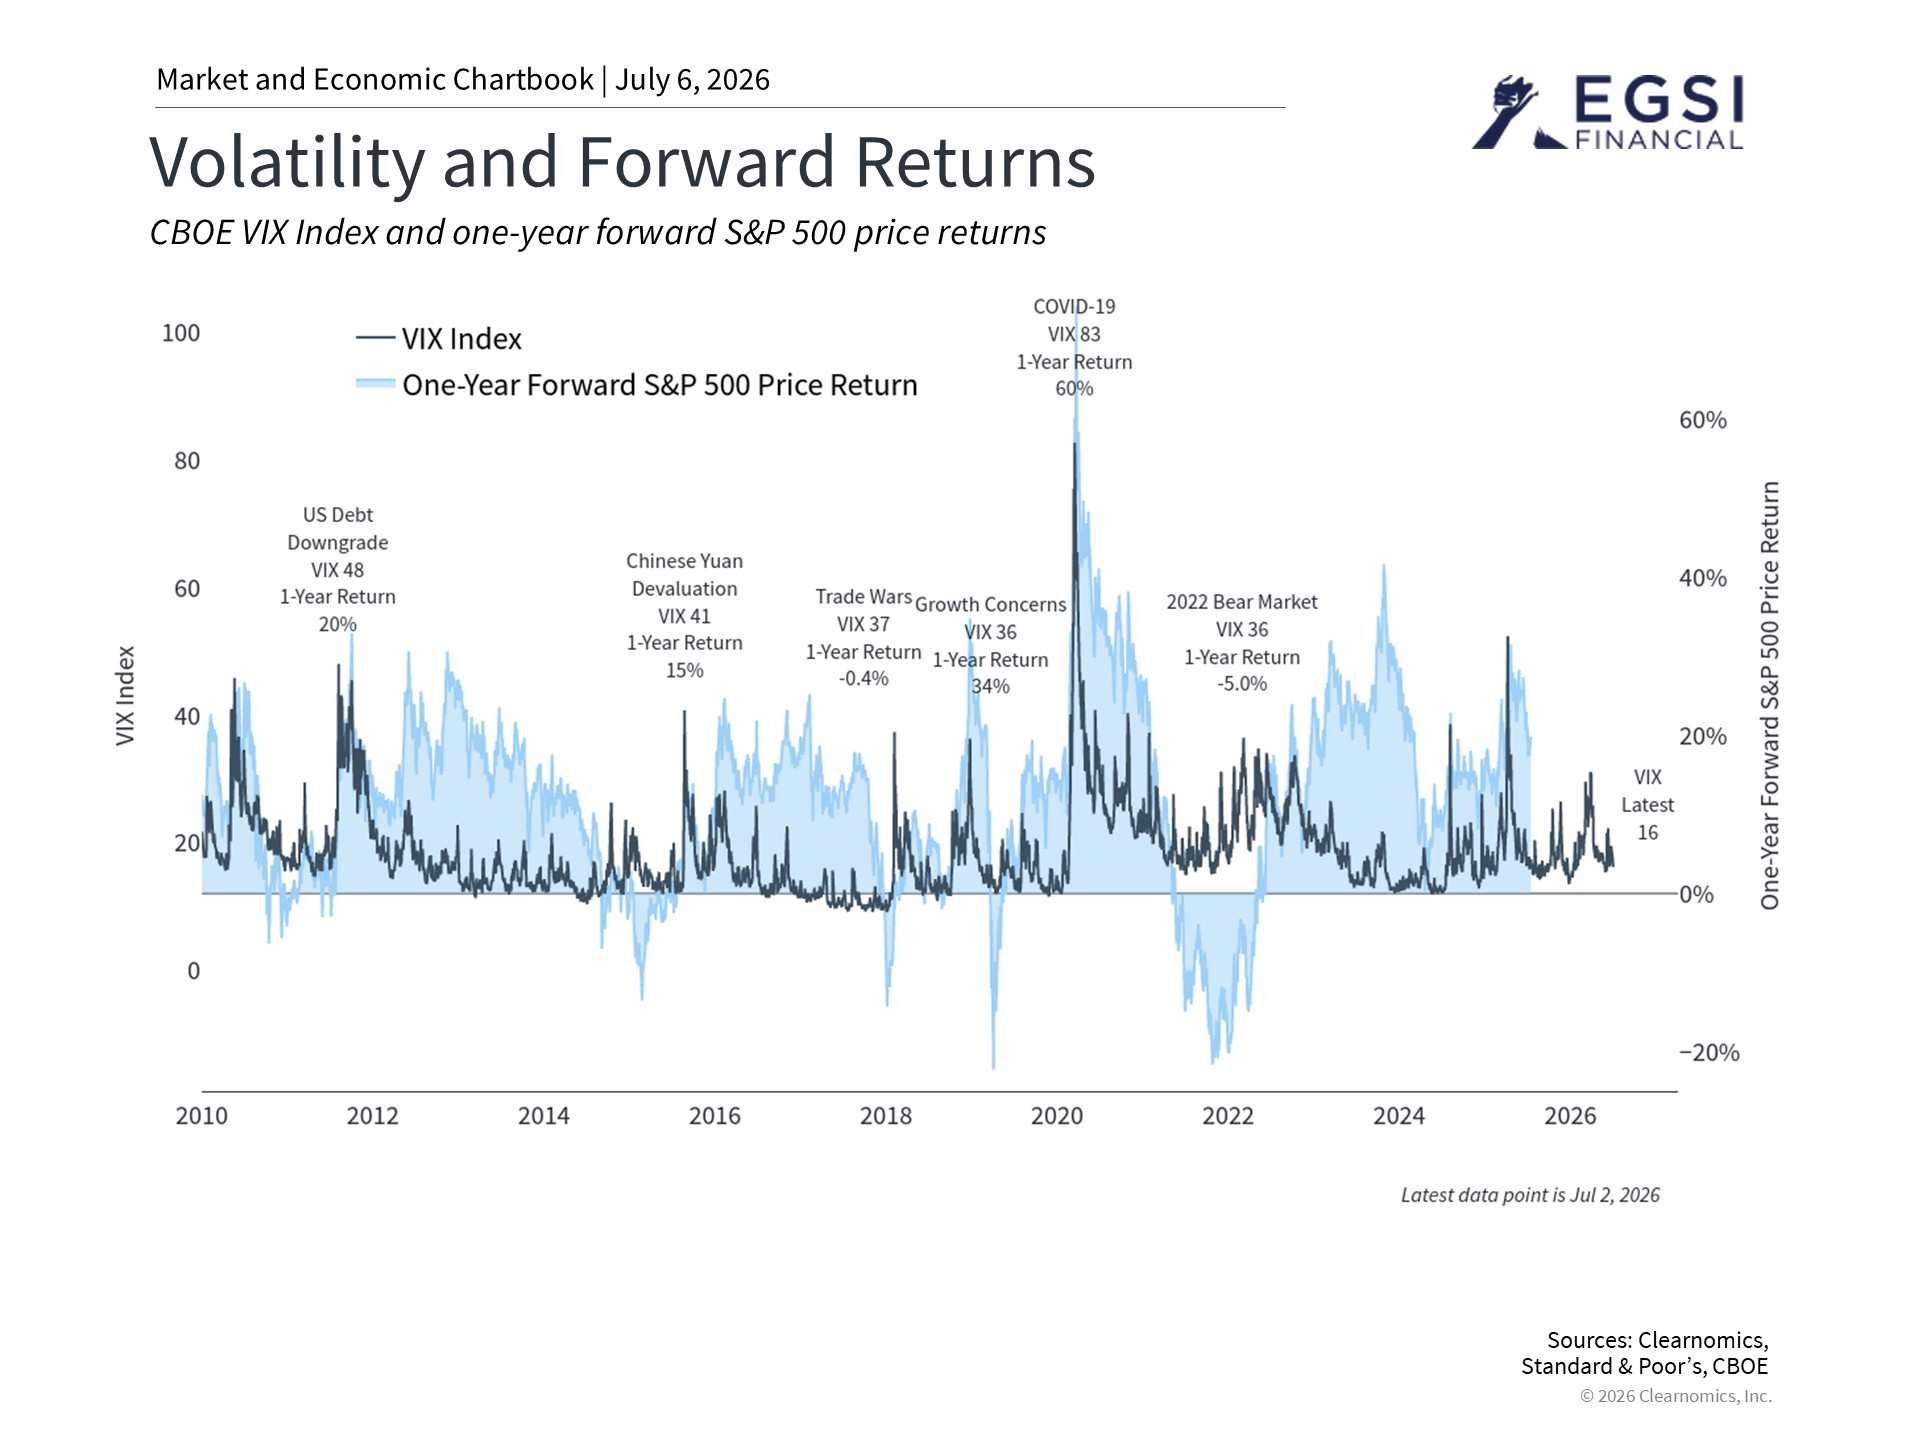
The VIX is a widely used measure of stock market volatility (how much prices are expected to swing). The current VIX reading of 16 is below its long-term average of 18.4 and well below recent peaks. The largest market decline in 2026 so far has been 9%, but the market has fully recovered and the S&P 500 has reached 24 new all-time highs this year.6
The real risk during volatile periods is not the market swings themselves, but how investors respond to them. Trying to time the market, meaning moving in and out based on short-term news, can easily backfire. Holding a well-balanced portfolio designed for the long term is a more reliable approach.
Staying invested matters more than sitting on the sidelines
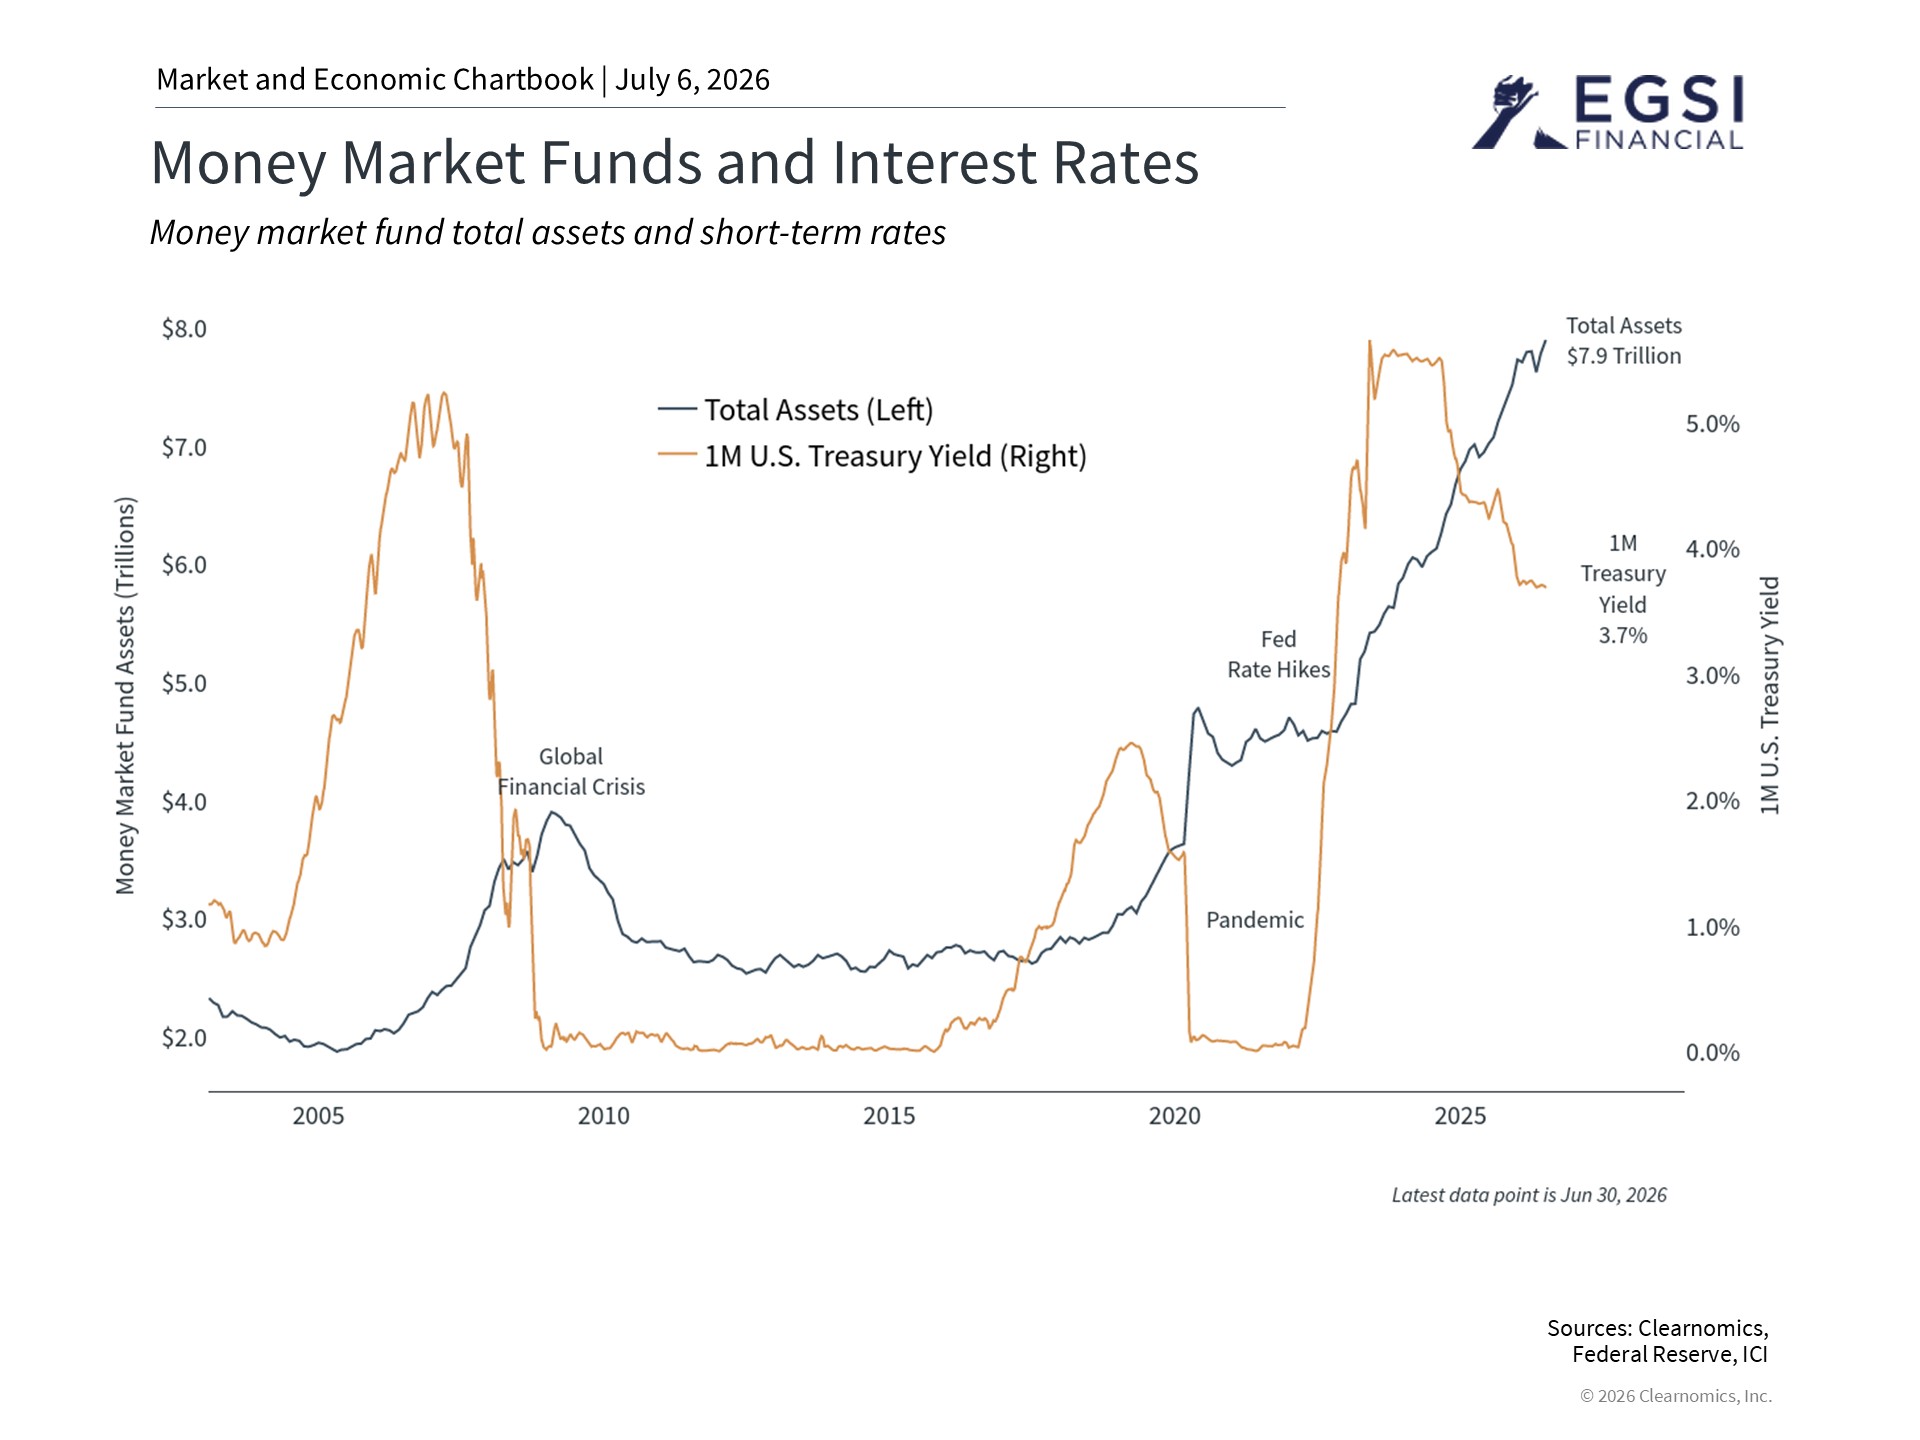
Many investors move to cash during uncertain markets, hoping to avoid losses. But this raises a difficult question: when do you get back in? Money market fund assets (short-term cash-like investments) have reached a record $7.9 trillion, more than double their pre-pandemic level. While cash feels safe, its returns often fail to keep up with inflation. In fact, the real return on cash (after adjusting for inflation) is currently negative.7 Over time, holding too much cash can quietly erode purchasing power.
The first half of 2026 reinforces the importance of holding a balanced portfolio that can generate growth and income while managing risk. This approach becomes even more valuable as both the market and economic cycle continue to evolve.
The bottom line? The first half of 2026 has rewarded investors who stayed diversified and maintained a long-term perspective, even as geopolitical and economic headlines created short-term uncertainty.
References
1. All figures are as of June 30, 2026 and are on a price return basis unless otherwise noted
2. Clearnomics research and LSEG data as of June 30, 2026
3. Ibid.
4. https://gasprices.aaa.com/
5. https://www.bls.gov/news.release/cpi.nr0.htm
6. Clearnomics research and Standard & Poor’s data as of June 30, 2026
7. Clearnomics research and FDIC data as of June 30, 2026
Index Descriptions
S&P 500
The Standard & Poor’s 500 Index is a capitalization-weighted index of 500 stocks designed to measure performance of the broad domestic economy through changes in the aggregate market value of 500 stocks representing all major industries.
Dow Jones Industrial Average
The Dow Jones Industrial Average consists of 30 stocks that are major factors in their industries and widely held by individuals and institutional investors.
NASDAQ
The NASDAQ Composite Index measures all NASDAQ domestic and non-U.S. based common stocks listed on The NASDAQ Stock Market. The market value, the last sale price multiplied by total shares outstanding, is calculated throughout the trading day, and is related to the total value of the Index.
MSCI Emerging Markets Index
The MSCI EM (Emerging Markets) Index is a free float-adjusted market capitalization weighted index that is designed to measure the equity market performance of the emerging market countries of the Americas, Europe, the Middle East, Africa and Asia. The MSCI EM Index consists of the following emerging market country indices: Brazil, Chile, Colombia, Mexico, Peru, Czech Republic, Egypt, Greece, Hungary, Poland, Qatar, Russia, South Africa, Turkey, United Arab Emirates, China, India, Indonesia, Korea, Malaysia, Philippines, Taiwan, and Thailand.
MSCI EAFE Index
The MSCI EAFE Index is a free float-adjusted market capitalization index that is designed to measure the equity market performance of developed markets, excluding the US & Canada. The MSCI EAFE Index consists of the following developed country indices: Australia, Austria, Belgium, Denmark, Finland, France, Germany, Hong Kong, Ireland, Israel, Italy, Japan, the Netherlands, New Zealand, Norway, Portugal, Singapore, Spain, Sweden, Switzerland and the UK.
Bloomberg US Aggregate Bond Index
The Bloomberg U.S. Aggregate Bond Index is an index of the U.S. investment-grade fixed-rate bond market, including both government and corporate bonds.
We are an independent financial services firm helping individuals create retirement strategies using a variety of investment and insurance products to custom suit their needs and objectives.
Advisory services offered through EGSI Investment Management, Inc., a Registered Investment Advisor with the State of Ohio. Insurance services offered through EGSI Financial, Inc.
Investing involves risk, including the potential loss of principal. No investment strategy can guarantee a profit or protect against loss in periods of declining values. None of the information contained on this website shall constitute an offer to sell or solicit any offer to buy a security or any insurance product.
Any references to protection benefits, safety, security, or steady and lifetime income streams on this website refer only to fixed insurance products. They do not refer, in any way, to securities or investment advisory products. Annuity guarantees are backed by the financial strength and claimspaying ability of the issuing insurance company. Annuities are insurance products that may be subject to fees, surrender charges and holding periods which vary by insurance company. Annuities are not FDIC insured.
The information and opinions contained in any of the material requested from this website are provided by third parties and have been obtained from sources believed to be reliable, but accuracy and completeness cannot be guaranteed. They are given for informational purposes only and are not a solicitation to buy or sell any of the products mentioned. The information is not intended to be used as the sole basis for financial decisions, nor should it be construed as advice designed to meet the particular needs of an individual’s situation.