
The third quarter of 2026 presented a mixed picture for investors, shaped by two major forces. Interest rates climbed to their highest levels in 20 years, while strong corporate earnings continued to support stock prices. Oil prices rose back above $100 per barrel, the Federal Reserve (the central bank of the United States, often called “the Fed”) raised its key interest rate for the first time in three years, and questions about artificial intelligence (AI) grew as the November midterm elections approached.
Despite all of this, major U.S. stock market indexes ended the quarter near record highs. Gains were not limited to one area of the market: energy stocks, international stocks, and commodities (physical goods like oil and metals) all added value to portfolios. Bonds, which are loans investors make to governments or companies in exchange for regular interest payments, have struggled as rates have risen, but they now offer the most attractive income in years. These trends remind us that keeping a balanced portfolio is essential, especially when markets are changing and creating new opportunities.
Key market and economic highlights for Q3 20261
• The S&P 500 returned 2.3% in the third quarter with dividends, the Nasdaq Composite gained 2.6%, and the Dow Jones Industrial Average declined -2.3%. Year-to-date, these three indexes returned 12.7%, 16.1%, and 7.2%, respectively.
• Developed market international stocks (MSCI EAFE) gained 0.9%, while emerging market stocks (MSCI EM) declined -0.4% over the quarter, both measured in U.S. dollar terms.
• The Bloomberg U.S. Aggregate Bond Index fell -3.5% in the third quarter for a year-to-date decline of -2.9%. The 10-year Treasury yield climbed to 5.29%, a two-decade high.
• The Bloomberg Commodity Index jumped 15.1% over the quarter. Brent crude ended the quarter at $103 per barrel while WTI finished at $90.
• Gold fell to $4,156 per ounce, while the U.S. Dollar Index recovered to 101.45.
• August headline Consumer Price Index (CPI), a common measure of inflation, rose 3.4% year-over-year. Core CPI, which excludes volatile food and energy prices, increased 2.4%. The Fed’s preferred inflation measure, core Personal Consumption Expenditures (PCE), rose 3.0% year-over-year in August.
• The Federal Reserve raised its key policy rate to a range of 3.75% to 4.00% in September.
• The third estimate of second quarter Gross Domestic Product (GDP, the total value of goods and services produced in the country) showed growth of 2.2% quarter-over-quarter, driven largely by a 2.5% gain in personal consumption expenditures.
Investors are adjusting to a higher interest rate environment
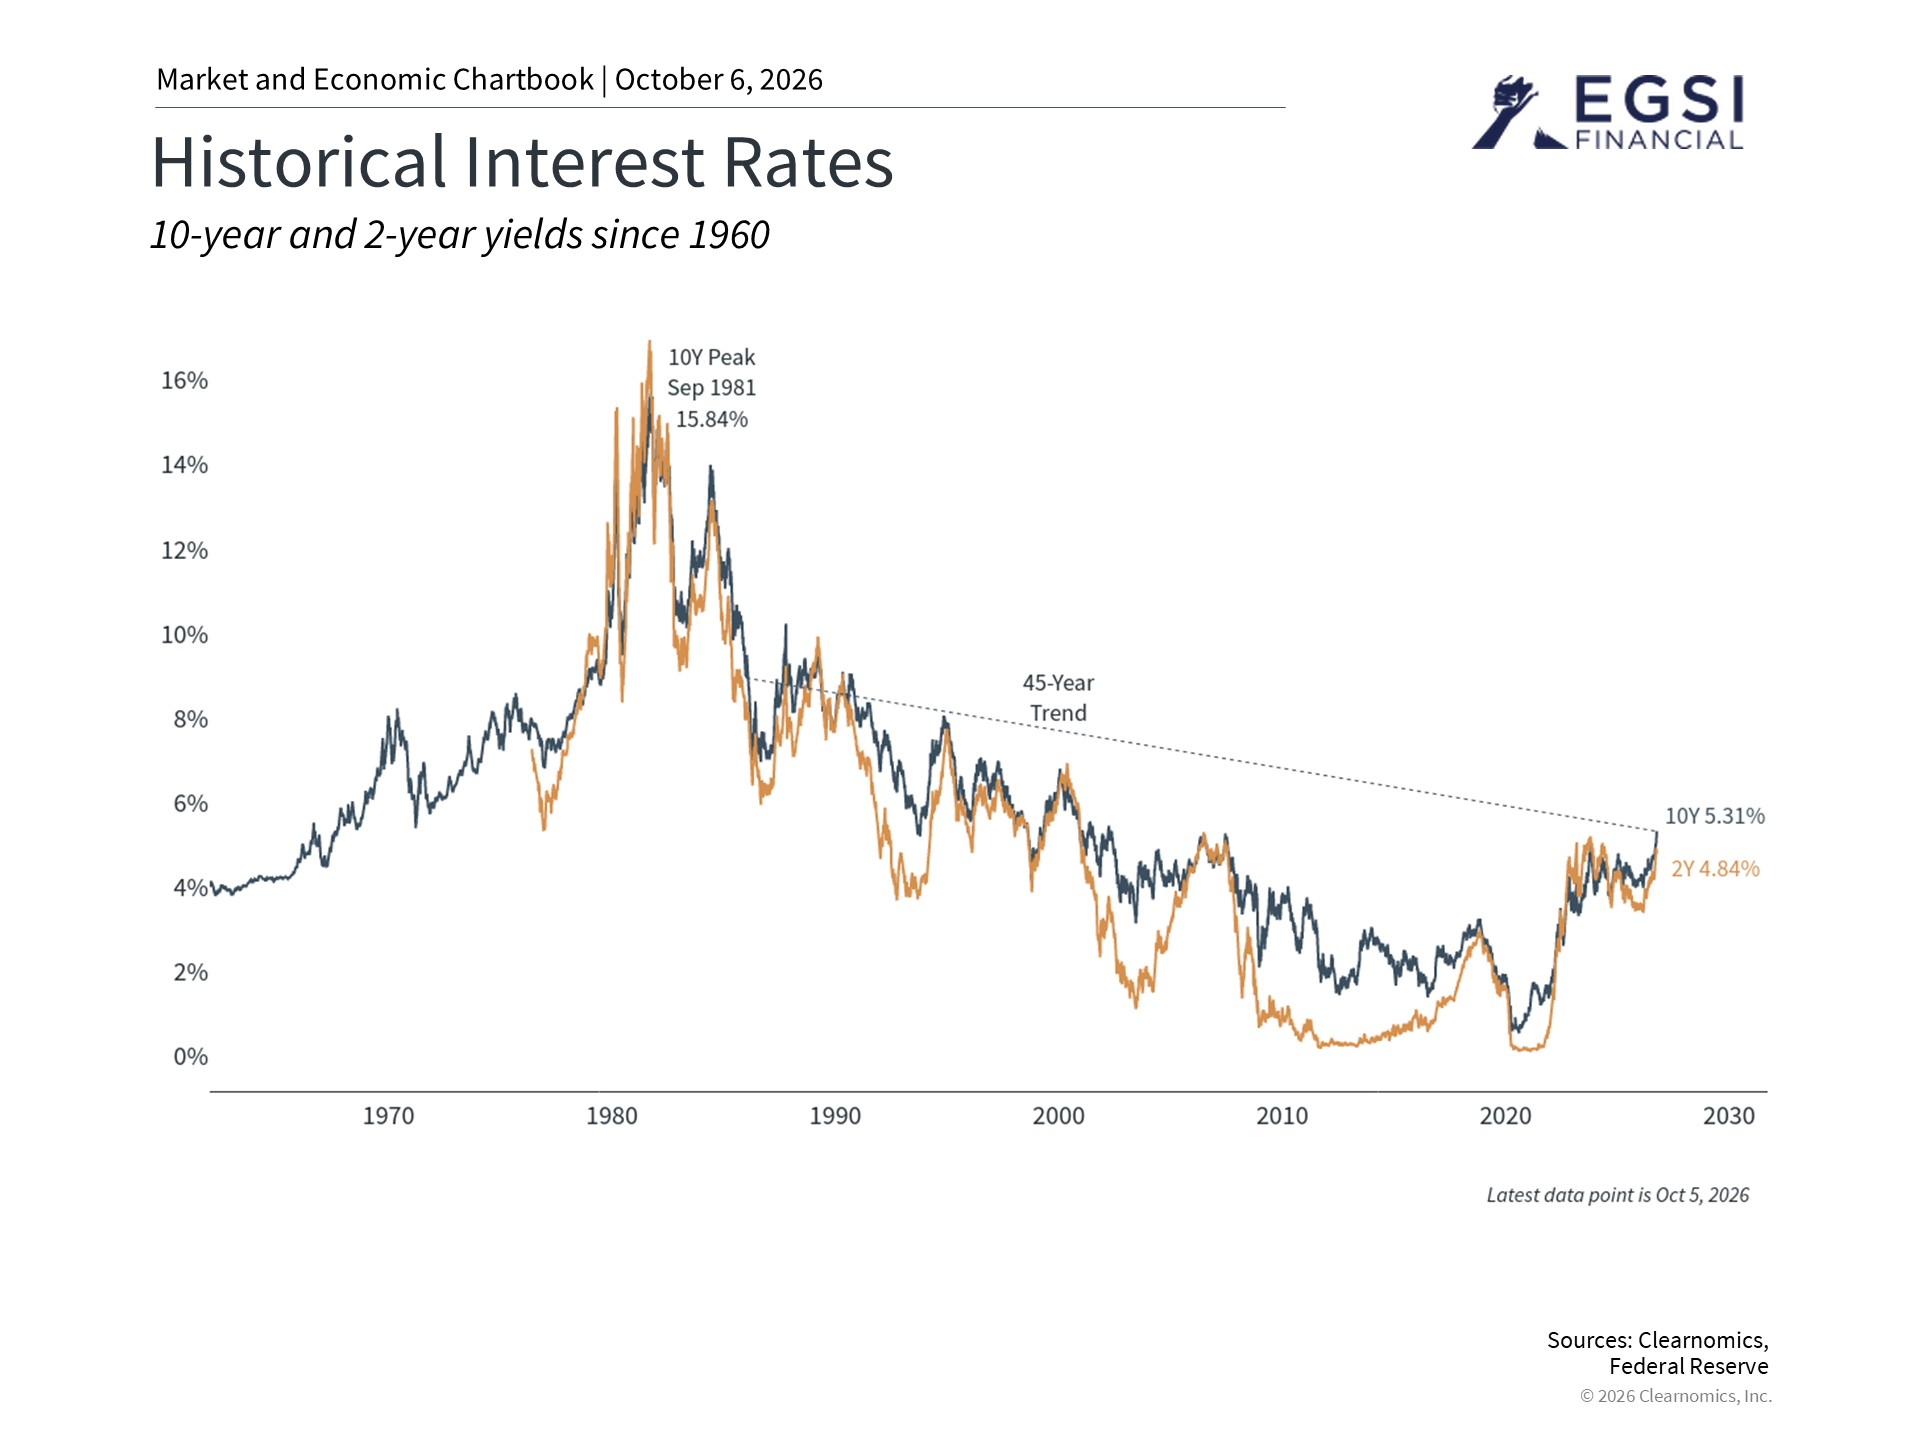
The standout story of the third quarter was the steady rise in interest rates to levels last seen in the early 2000s. From the early 1980s through 2020, interest rates generally fell over time, a period sometimes called a 40-year bull market in bonds, since falling rates make existing bonds more valuable.2 That long era of low rates is now over, and the higher income that bonds can generate today is an important factor when deciding how to divide a portfolio between stocks and bonds.
Higher rates also affect other parts of the economy. According to Freddie Mac, the average 30-year fixed-rate mortgage has moved back above 7% after falling toward 6% at the start of the year.3 This creates what economists call the “lock-in” effect, where homeowners who locked in low rates in prior years have little incentive to sell, slowing activity in the housing market. While rates are hard to predict, they are currently near multi-decade highs, which is a significant development for investors.
Earnings growth and AI investment are lifting many parts of the market
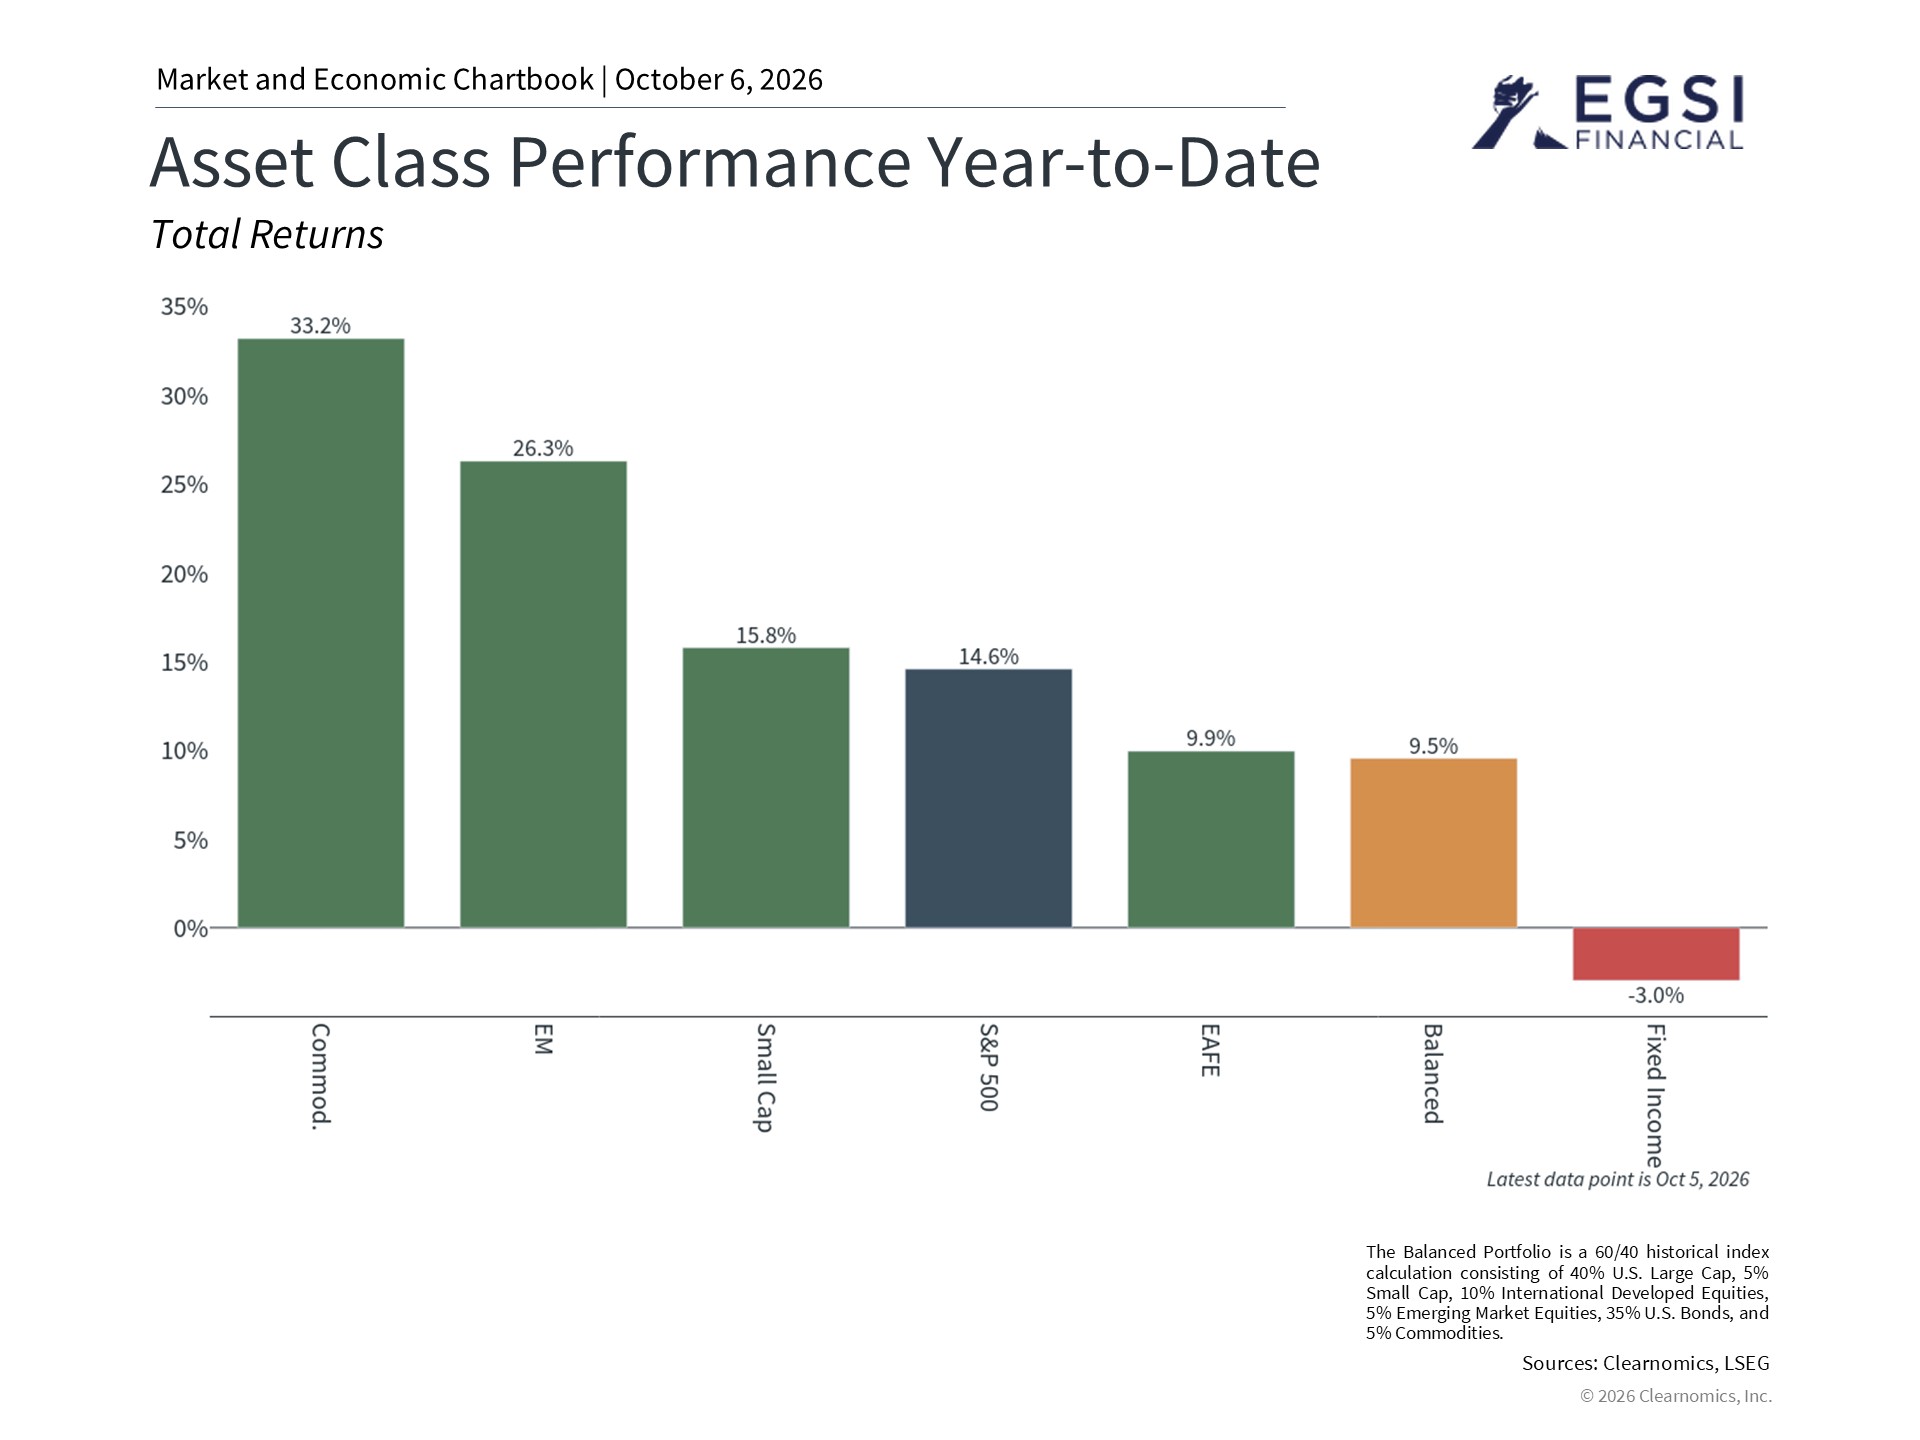
Major U.S. stock indexes reached new all-time highs in the third quarter, supported by a strong economy and significant investment in AI technology. Current estimates suggest that S&P 500 earnings could grow over 30% for the next twelve months.4 Strong performance was not limited to U.S. large company stocks. Smaller companies and international markets also benefited, particularly those linked to the AI supply chain in Asia, though the MSCI Emerging Market index did decline in the third quarter.5
Commodities also contributed to portfolio performance. Oil prices climbed from around $70 per barrel in early July to over $100 in September due to ongoing conflict in the Middle East. Copper reached a new all-time high due to supply shortages and demand from AI infrastructure. The fact that many different types of investments contributed to returns highlights the value of holding a well-balanced portfolio.
The Fed raised rates for the first time in three years
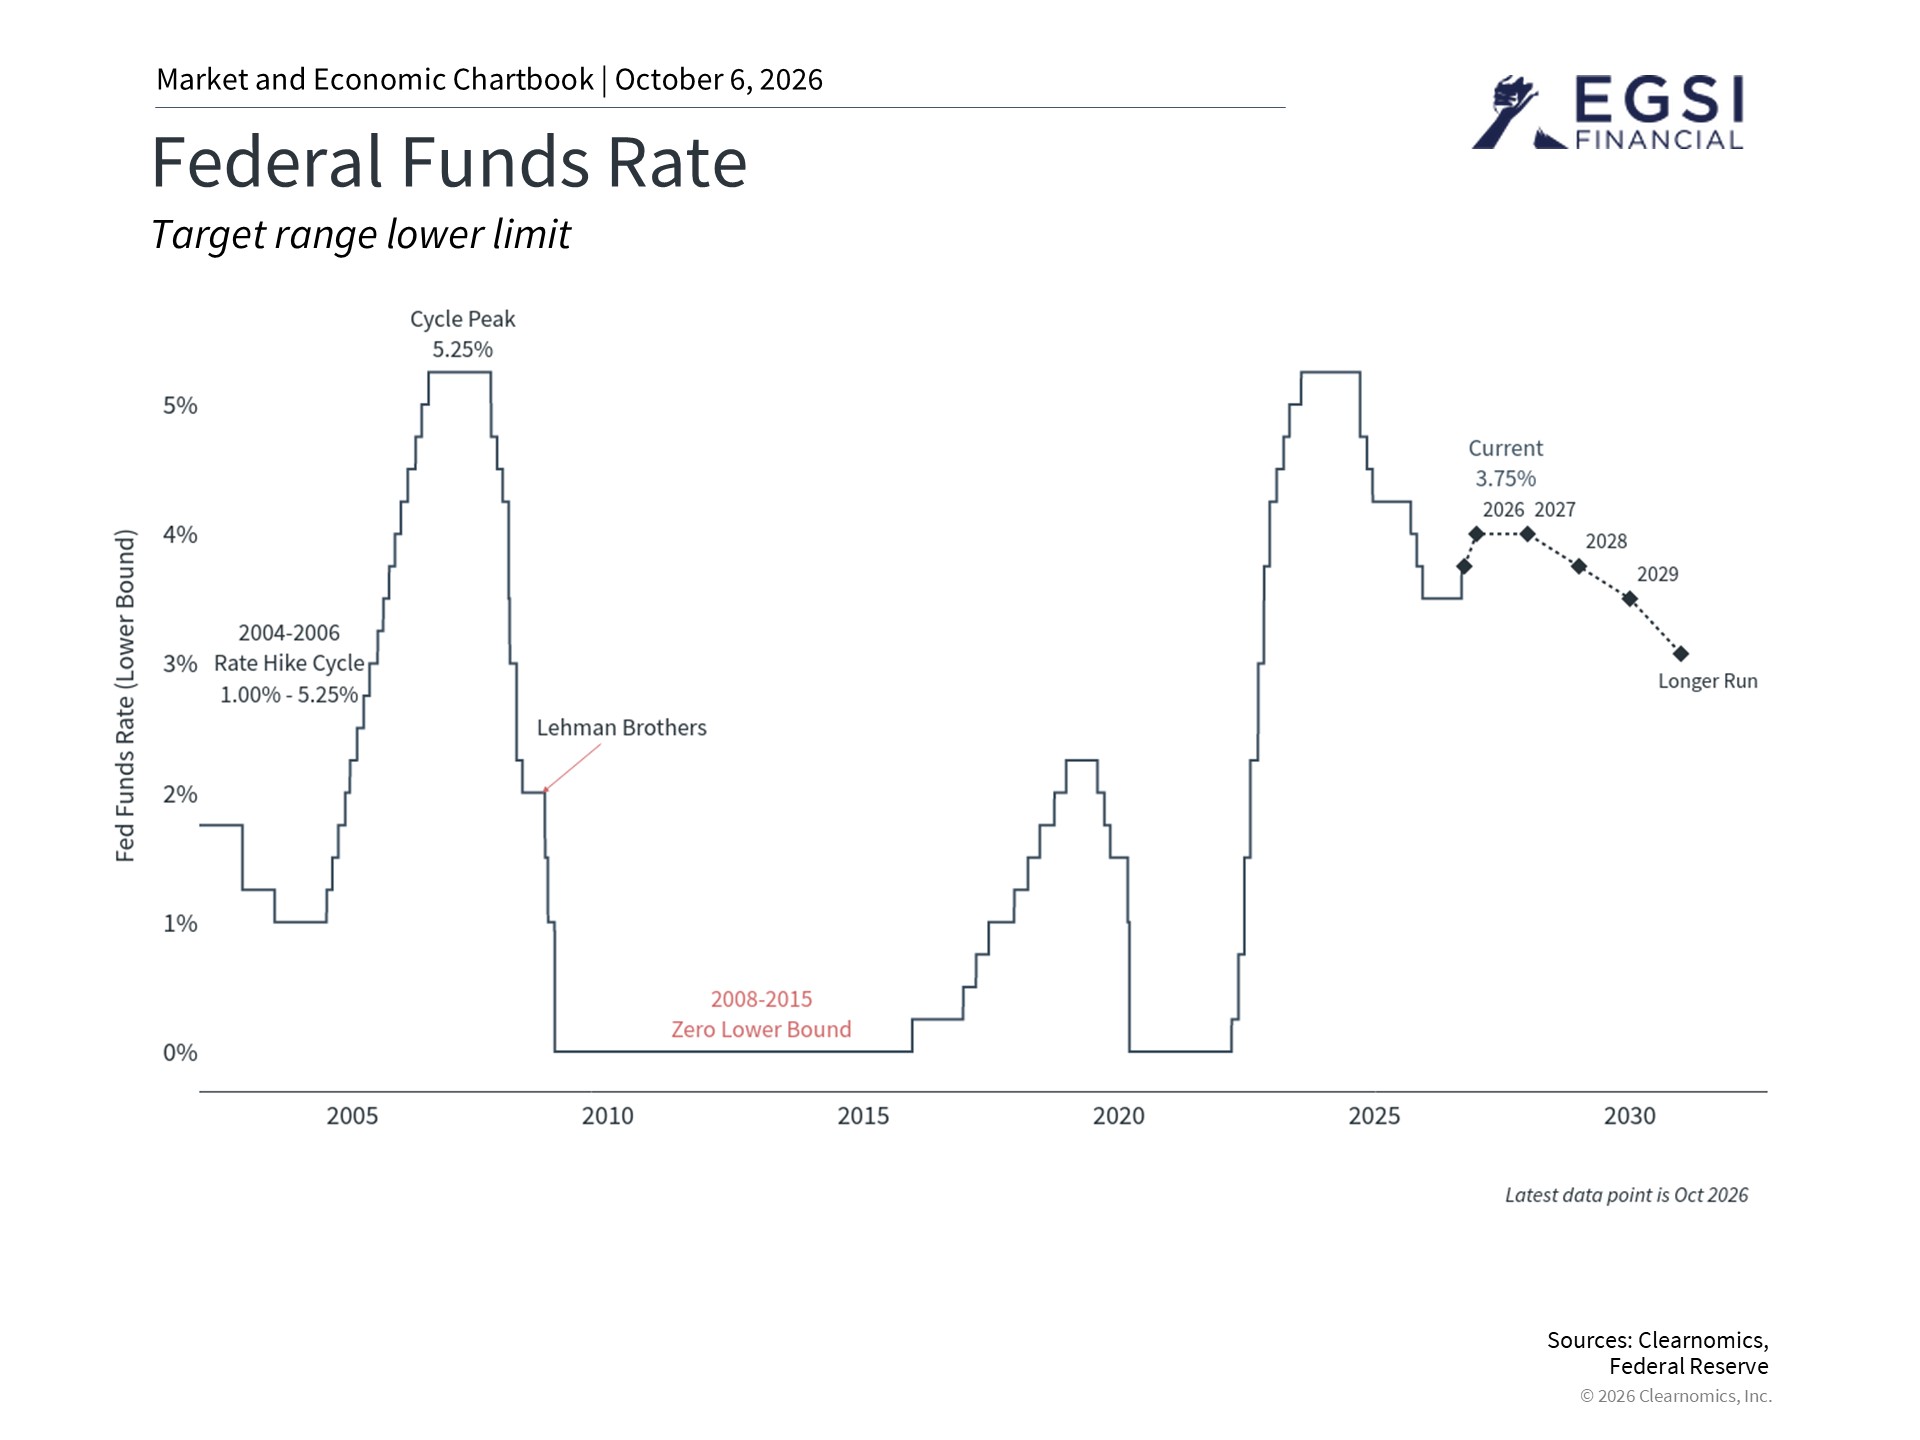
At its September meeting, the Fed raised its policy rate by one-quarter of a percent to a range of 3.75% to 4.00%. This was the first rate increase in three years, following a series of cuts from September 2024 to December 2025. Investors had assigned the move over a 90% probability ahead of the meeting, so markets absorbed the news relatively calmly.6 The Fed is primarily reacting to higher energy prices, a situation economists call “cost-push inflation,” where supply disruptions push prices higher. The Fed cannot control geopolitical events, but it can try to prevent rising energy costs from spreading to other areas of the economy.
Historically, it is not unusual for stock markets and interest rates to rise at the same time, especially later in an economic cycle when growth and corporate earnings are strong. The third quarter is a good example of this. Current projections suggest the Fed could raise rates once more this year before pausing through 2027, though these projections can change quickly as economic conditions evolve.
Upcoming midterm elections and policy uncertainty
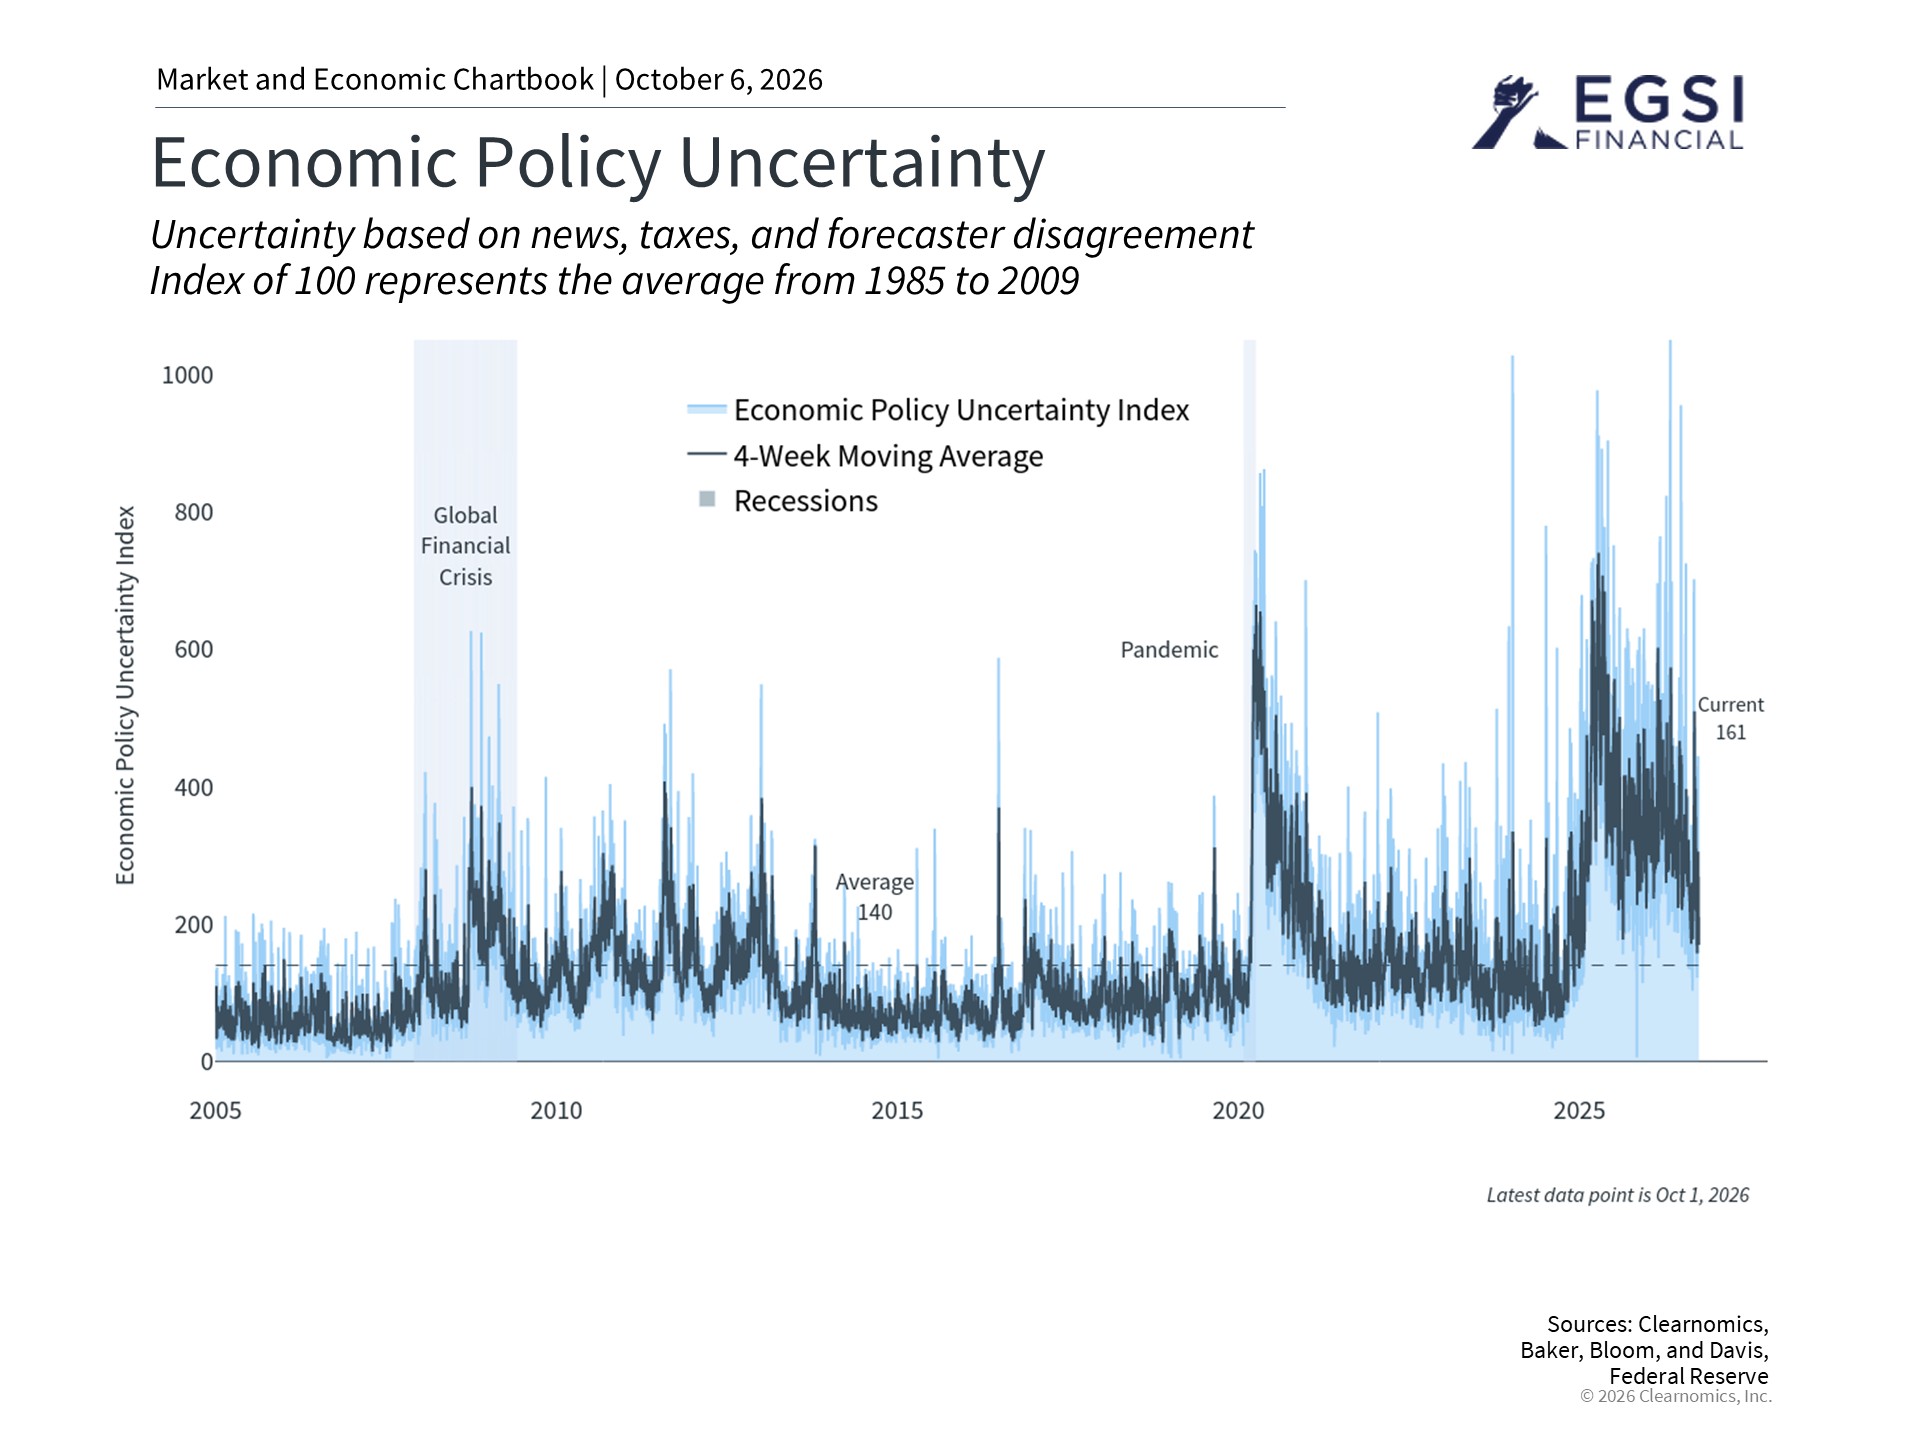
Elections matter greatly as citizens and voters, but when it comes to investing, it is important not to make major portfolio changes based on political outcomes. History shows that the S&P 500 has averaged annual total returns of 8.6% across midterm election years since 1933.7 Markets have also performed well on average under many different configurations of Congress, and it is not unusual for a sitting president’s party to lose its majority in a midterm election.8
Another concern for investors is the size of the national debt, which recently exceeded $40 trillion for the first time, or nearly $120,000 per American.9 The annual budget deficit is projected to exceed $2 trillion for the government’s 2026 fiscal year.10 Over time, these trends could raise the government’s borrowing costs. While these challenges are real, the key for investors is to hold a portfolio built to perform across a range of conditions, rather than trying to predict any single political or economic outcome.
AI, productivity, and the performance of different market sectors
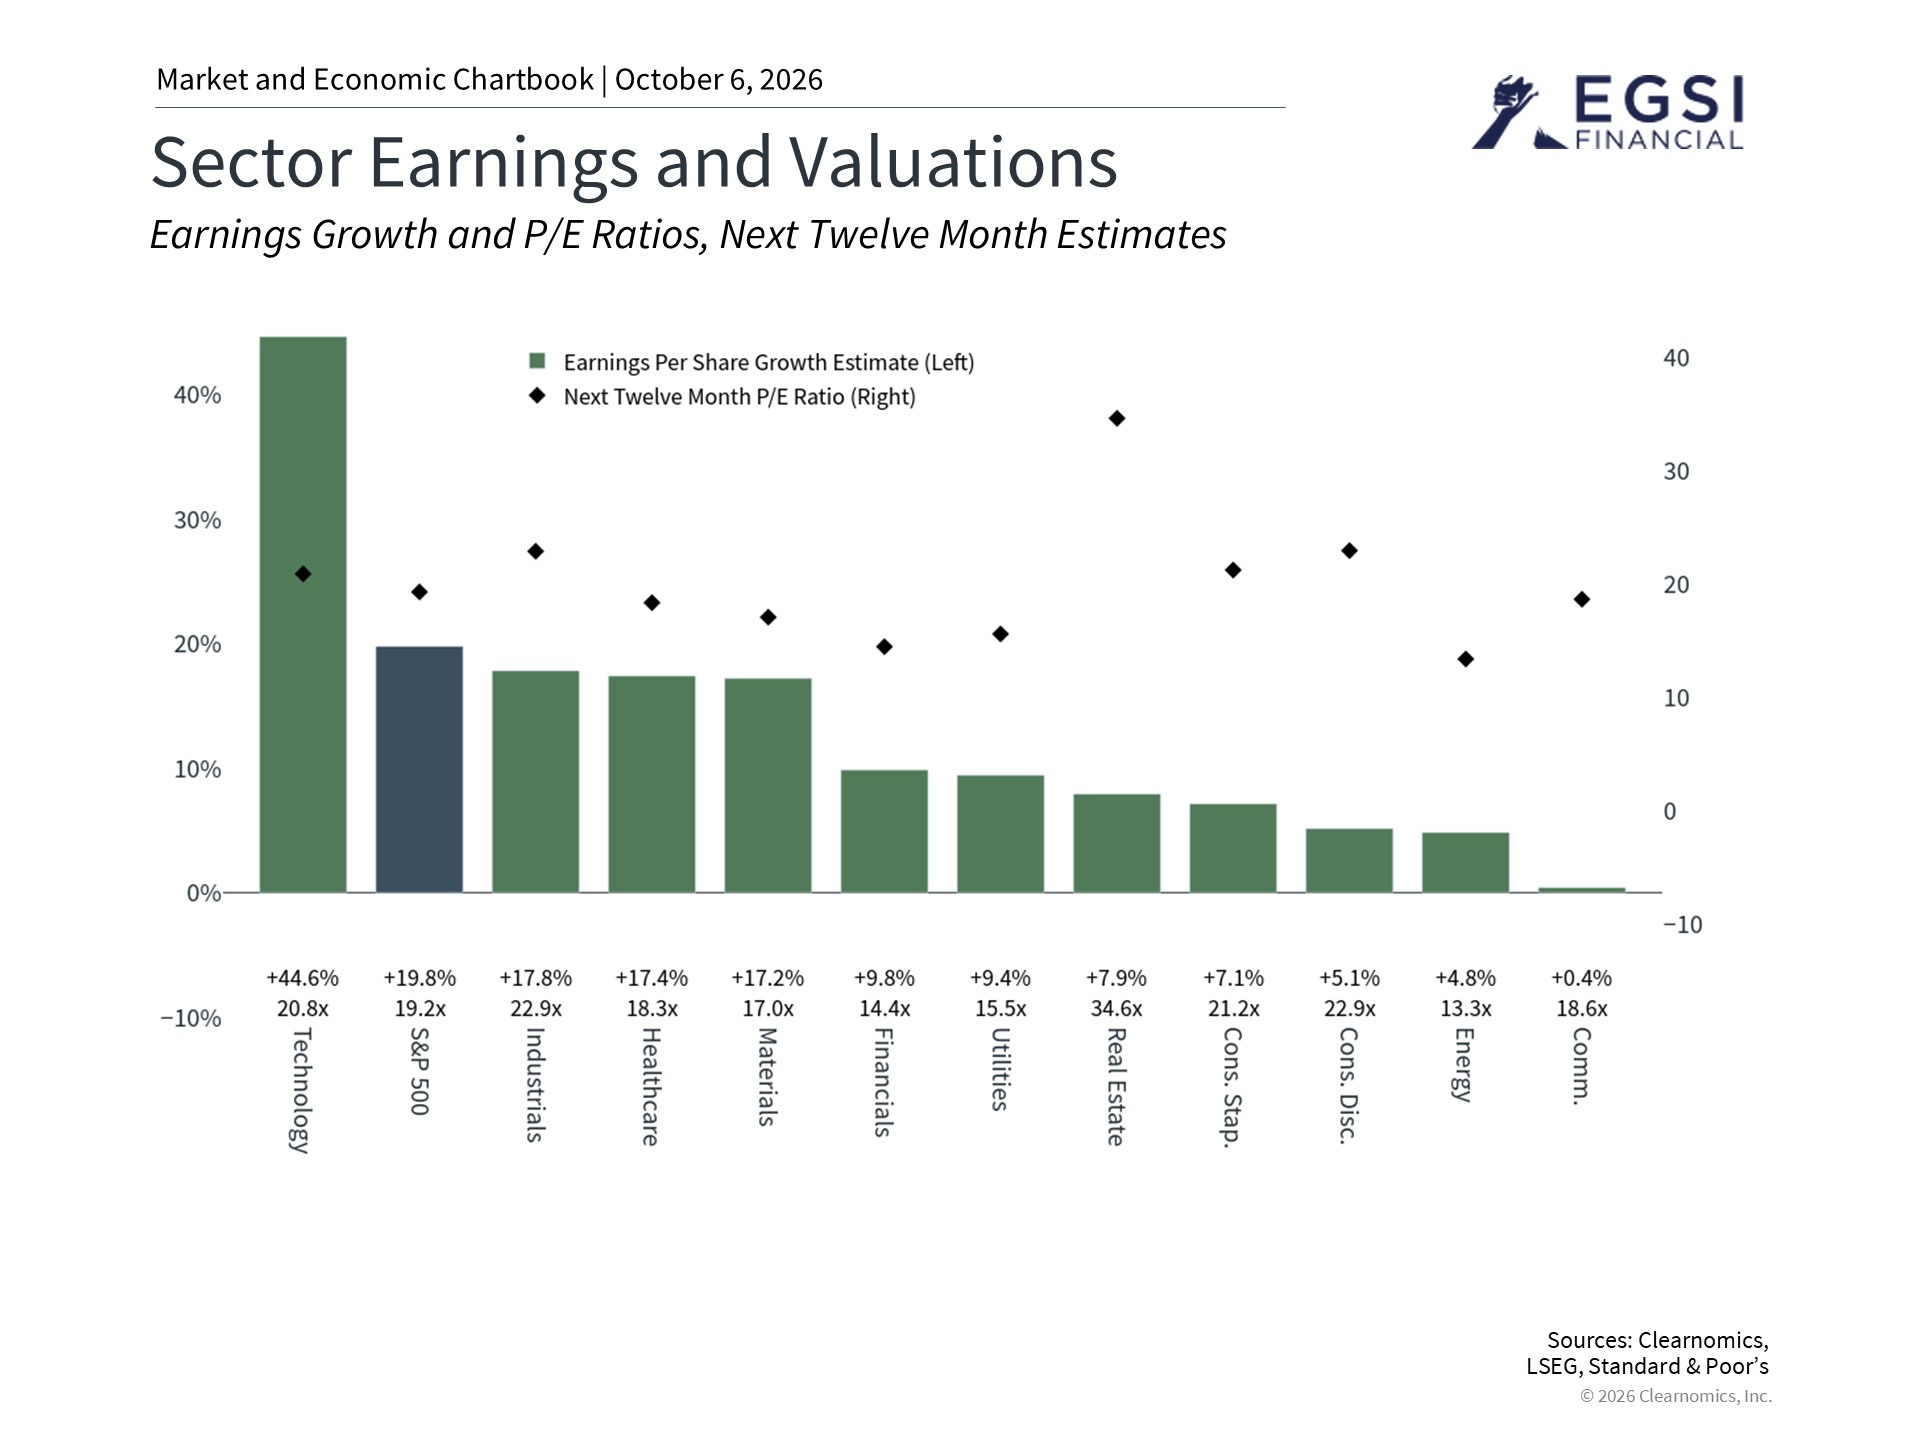
AI and technology have been major drivers of market performance over the past decade, boosting groups like the Magnificent 7 and supporting earnings growth broadly. The chart above shows the difference in earnings growth between the Information Technology sector and the other ten S&P 500 sectors.11 Some investors worry about “concentration risk,” meaning the market is increasingly driven by just a few large companies. However, other sectors have also contributed strong returns. The energy sector, for example, has benefited from higher oil prices and is the best performing sector with a 37.4% year-to-date gain through the third quarter.
A key question for the future is whether AI will lead to genuine productivity growth, meaning companies can produce more with the same resources. So far, the 2020s have seen average productivity growth of 2.1% per year, compared to only 1.2% in the 2010s. Whether AI and new technologies will continue to boost this remains an open question that will likely shape markets and the economy in the years ahead. Keeping a long-term perspective, and understanding how these trends interact with higher interest rates, can help investors stay on course through the final quarter of the year.
The bottom line? Stocks reached new highs in the third quarter, with many asset classes contributing to portfolios, despite bonds struggling as interest rates rise. As new developments unfold and the midterm election approaches, investors should continue to stay balanced and focus on financial goals.
References
1. Return figures represent total returns with reinvested dividends. All figures as of September 30, 2026
2. Clearnomics research using Federal Reserve data, as of September 30, 2026
3. https://www.freddiemac.com/pmms
4. Clearnomics research using LSEG data, as of September 30, 2026
5. Clearnomics research using FTSE Russell and MSCI data, as of September 30, 2026
6. https://www.cmegroup.com/markets/interest-rates/cme-fedwatch-tool.html
7. Clearnomics research using Standard & Poor’s data, as of September 30, 2026
8. Clearnomics research using Standard & Poor’s data, as of September 30, 2026
9. https://fiscaldata.treasury.gov/americas-finance-guide/national-debt/
10. Clearnomics research using LSEG and Standard & Poor’s data, as of September 30, 2026
11. https://fiscaldata.treasury.gov/americas-finance-guide/national-deficit/https://fiscaldata.treasury.gov/americas-finance-guide/national-debt/
Index Descriptions
S&P 500
The Standard & Poor’s 500 Index is a capitalization-weighted index of 500 stocks designed to measure performance of the broad domestic economy through changes in the aggregate market value of 500 stocks representing all major industries. The modern design of the S&P 500 stock index was first launched in 1957. Performance prior to 1957 incorporates the performance of the predecessor index, the S&P 90.
Dow Jones
The Dow Jones Industrial Average consists of 30 stocks that are major factors in their industries and widely held by individuals and institutional investors.
NASDAQ
The NASDAQ Composite Index measures all NASDAQ domestic and non-U.S. based common stocks listed on The NASDAQ Stock Market. The market value, the last sale price multiplied by total shares outstanding, is calculated throughout the trading day, and is related to the total value of the Index.
MSCI Emerging Markets Index
The MSCI EM (Emerging Markets) Index is a free float-adjusted market capitalization weighted index that is designed to measure the equity market performance of the emerging market countries of the Americas, Europe, the Middle East, Africa and Asia. The MSCI EM Index consists of the following emerging market country indices: Brazil, Chile, Colombia, Mexico, Peru, Czech Republic, Egypt, Greece, Hungary, Poland, Qatar, Russia, South Africa, Turkey, United Arab Emirates, China, India, Indonesia, Korea, Malaysia, Philippines, Taiwan, and Thailand.
MSCI EAFE Index
The MSCI EAFE Index is a free float-adjusted market capitalization index that is designed to measure the equity market performance of developed markets, excluding the US & Canada. The MSCI EAFE Index consists of the following developed country indices: Australia, Austria, Belgium, Denmark, Finland, France, Germany, Hong Kong, Ireland, Israel, Italy, Japan, the Netherlands, New Zealand, Norway, Portugal, Singapore, Spain, Sweden, Switzerland and the UK.
Bloomberg US Aggregate Bond Index
The Bloomberg U.S. Aggregate Bond Index is an index of the U.S. investment-grade fixed-rate bond market, including both government and corporate bonds.
DXY
The DXY is a U.S. dollar index based on a basket of currencies, including the Euro, Yen, Pound, Canadian Dollar, Swedish Krona and Swiss Franc.
We are an independent financial services firm helping individuals create retirement strategies using a variety of investment and insurance products to custom suit their needs and objectives.
Advisory services offered through EGSI Investment Management, Inc., a Registered Investment Advisor with the State of Ohio. Insurance services offered through EGSI Financial, Inc.
Investing involves risk, including the potential loss of principal. No investment strategy can guarantee a profit or protect against loss in periods of declining values. None of the information contained on this website shall constitute an offer to sell or solicit any offer to buy a security or any insurance product.
Any references to protection benefits, safety, security, or steady and lifetime income streams on this website refer only to fixed insurance products. They do not refer, in any way, to securities or investment advisory products. Annuity guarantees are backed by the financial strength and claims-paying ability of the issuing insurance company. Annuities are insurance products that may be subject to fees, surrender charges and holding periods which vary by insurance company. Annuities are not FDIC insured.
The information and opinions contained in any of the material requested from this website are provided by third parties and have been obtained from sources believed to be reliable, but accuracy and completeness cannot be guaranteed. They are given for informational purposes only and are not a solicitation to buy or sell any of the products mentioned. The information is not intended to be used as the sole basis for financial decisions, nor should it be construed as advice designed to meet the particular needs of an individual’s situation.