

Many investors look to well-known market benchmarks like the S&P 500, Nasdaq Composite, and Dow Jones Industrial Average to get a sense of how the stock market is doing. These are useful starting points, but the stock market is actually made up of thousands of companies, each responding to economic and market forces in its own way. To make sense of these differences, stocks are often grouped by sector, location, company size, or investment style. Each of these groupings can play a meaningful role in a long-term investment portfolio.
Headlines about the S&P 500 hitting new records or the Nasdaq being powered by artificial intelligence can give the impression that all stocks move in the same direction at the same time. In reality, there is often a lot more going on under the surface. This is particularly true today, because key drivers such as AI, oil prices, interest rates, and tariffs touch all corners of the market, not just large companies. Understanding these forces can help investors stay well-balanced and work toward their long-term financial goals.
Over the past year, some areas of the market that do not always get as much attention, including smaller companies (known as “small caps”), value stocks, and international companies, have actually outperformed and have generally had more attractive prices relative to their fundamentals. Knowing how these different segments have performed can help investors keep their portfolios well-rounded. So, what is happening beneath the surface of the broad market, and why does it matter?
Different company sizes and investment styles respond to market conditions in their own ways
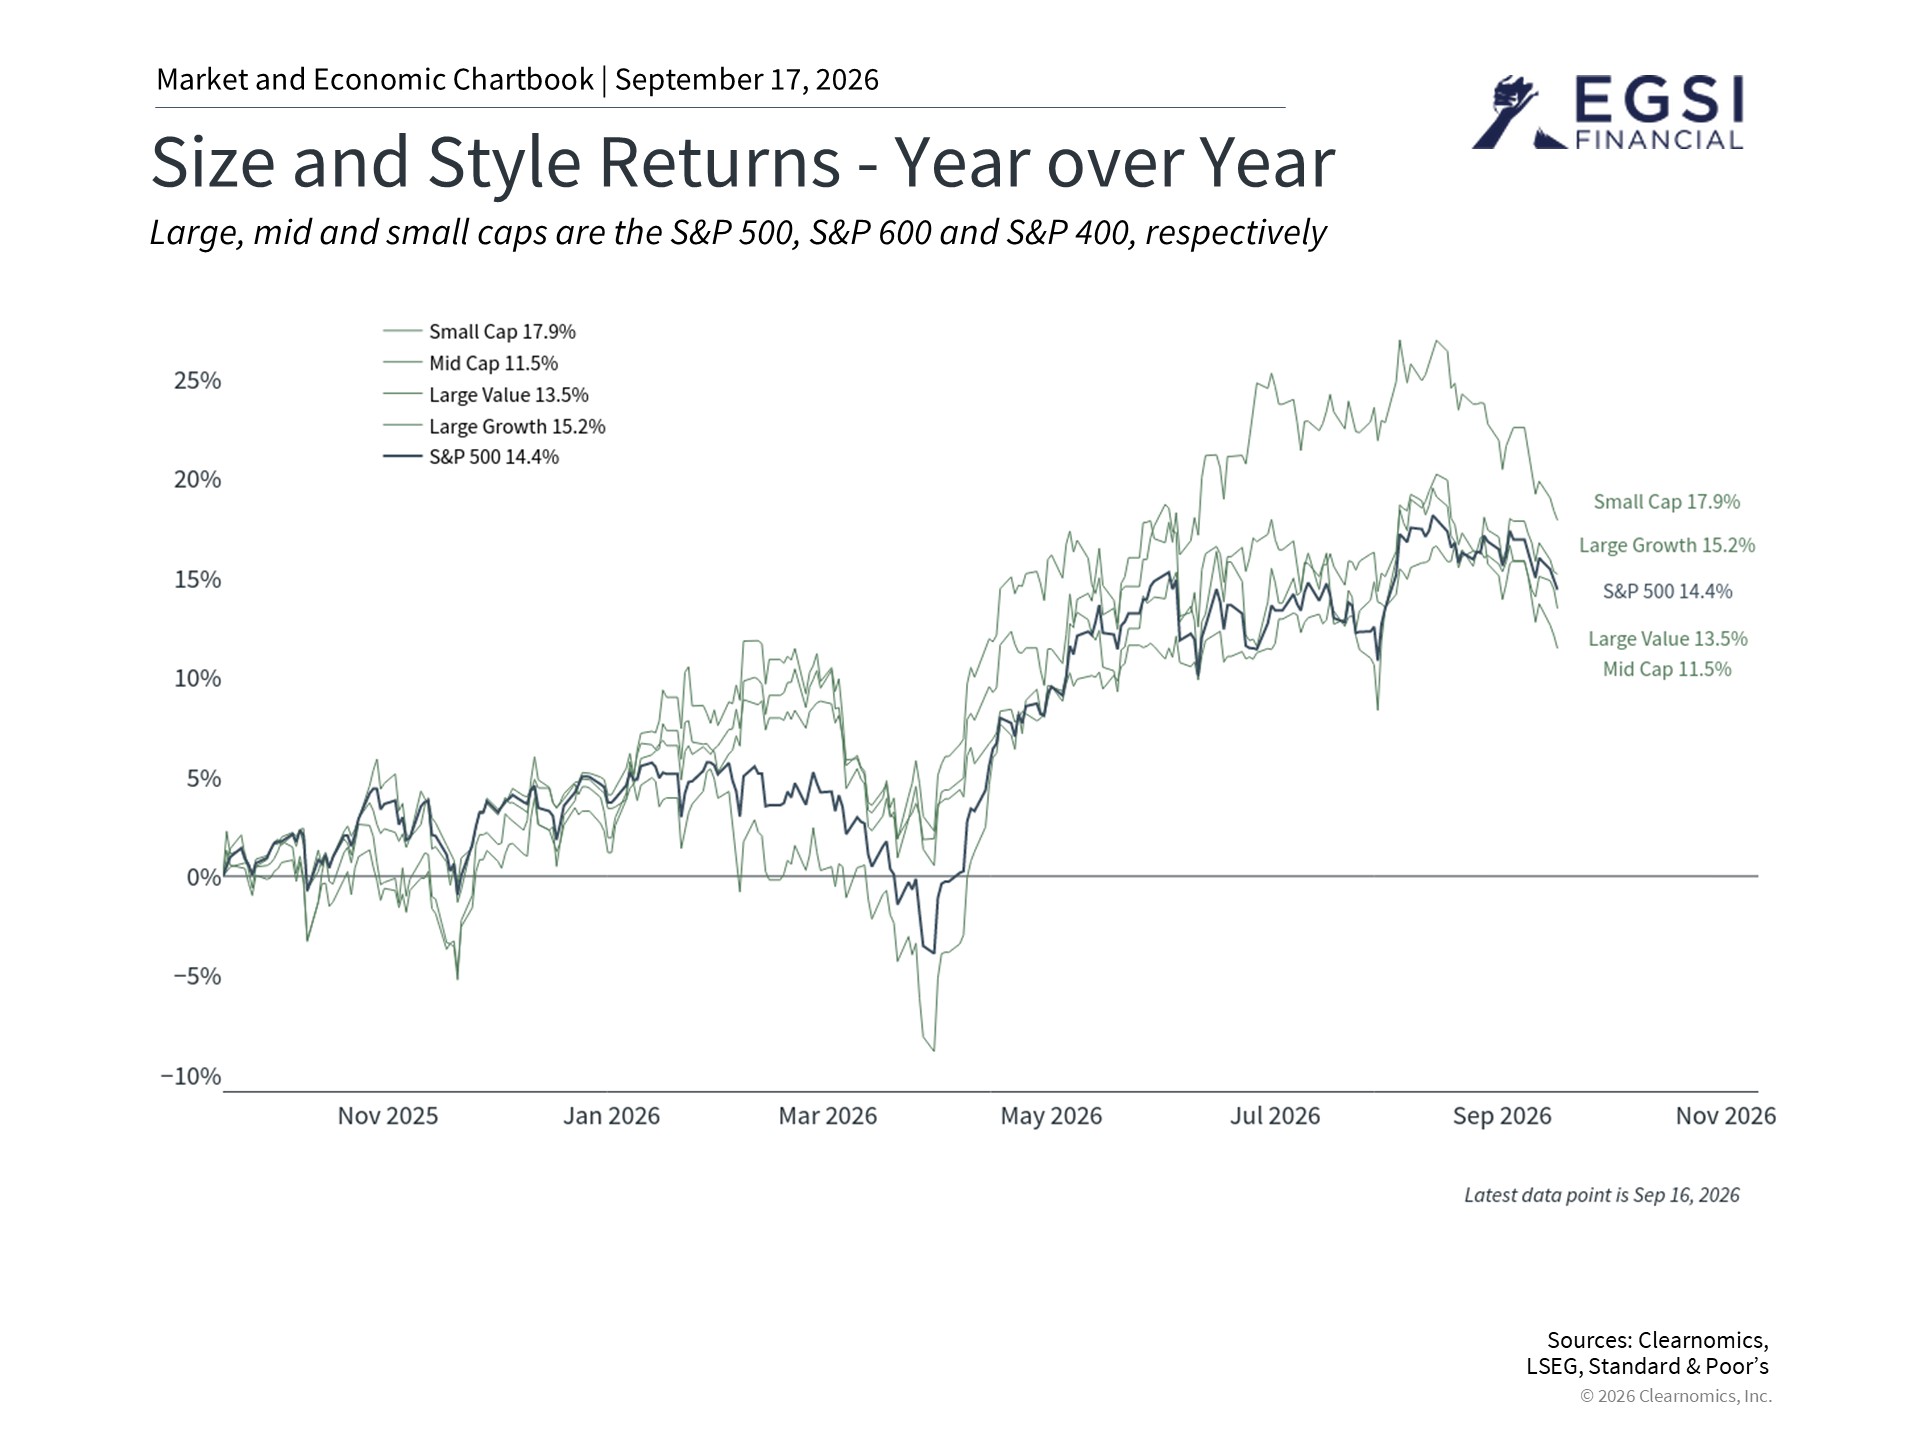
Even though the overall stock market has seen strong double-digit returns this year, at least two notable trends have been unfolding beneath the surface.1 The first is that value stocks have outperformed over the past year. This is a shift from the trend seen since 2022, when growth stocks produced strong returns thanks to excitement around technology and AI investments.2
Understanding the difference between value and growth stocks is important for investors, and it has been studied extensively by academics for the past 50 years.3 Value stocks are shares in companies that appear to be priced low compared to their actual financial performance, such as their earnings or sales. Growth stocks, on the other hand, are shares in companies with higher prices that reflect the expectation of strong future earnings and expanding market share. These stocks often represent exciting trends, such as dot-com companies in the late 1990s or AI companies today.
Value stocks have outperformed this year for several reasons, including uncertainty around interest rates and strong performance in the Energy sector driven by high oil prices.4 Interest rates are near their highest levels in several decades, which tends to weigh more heavily on growth stocks. This is because growth stock prices are built on expectations of future earnings, and when interest rates are high, the present value of those future earnings is reduced.
The second trend is that small cap stocks (shares in smaller companies) have outperformed large cap stocks (shares in bigger companies) this year, reversing a pattern that had been in place for well over a decade. In fact, before this year, small cap stocks had been trailing the S&P 500 since 2020.5
Small cap stocks have done well this year for many of the same reasons driving the broader market. AI, for example, is often seen as an opportunity mainly for large companies, but many smaller industrial and technology firms supply the parts, equipment, and services needed to build data centers and related infrastructure. As a result, these smaller businesses are seeing solid revenue and earnings growth that competes with many other areas of the market.
One challenge for small caps is that they tend to be more sensitive to interest rates, partly because smaller companies have less access to financing compared to large corporations. This has introduced more uncertainty for this group as long-term rates remain high and the possibility of Federal Reserve rate increases grows. However, history shows this relationship is not always straightforward. Two of the strongest periods for small cap outperformance came in the late 1970s and the mid-2000s, both of which were times of higher interest rates and inflation.6 One reason is that smaller businesses can sometimes raise their prices more easily, which can help improve their profit margins.
Valuations play an important role in long-term investing
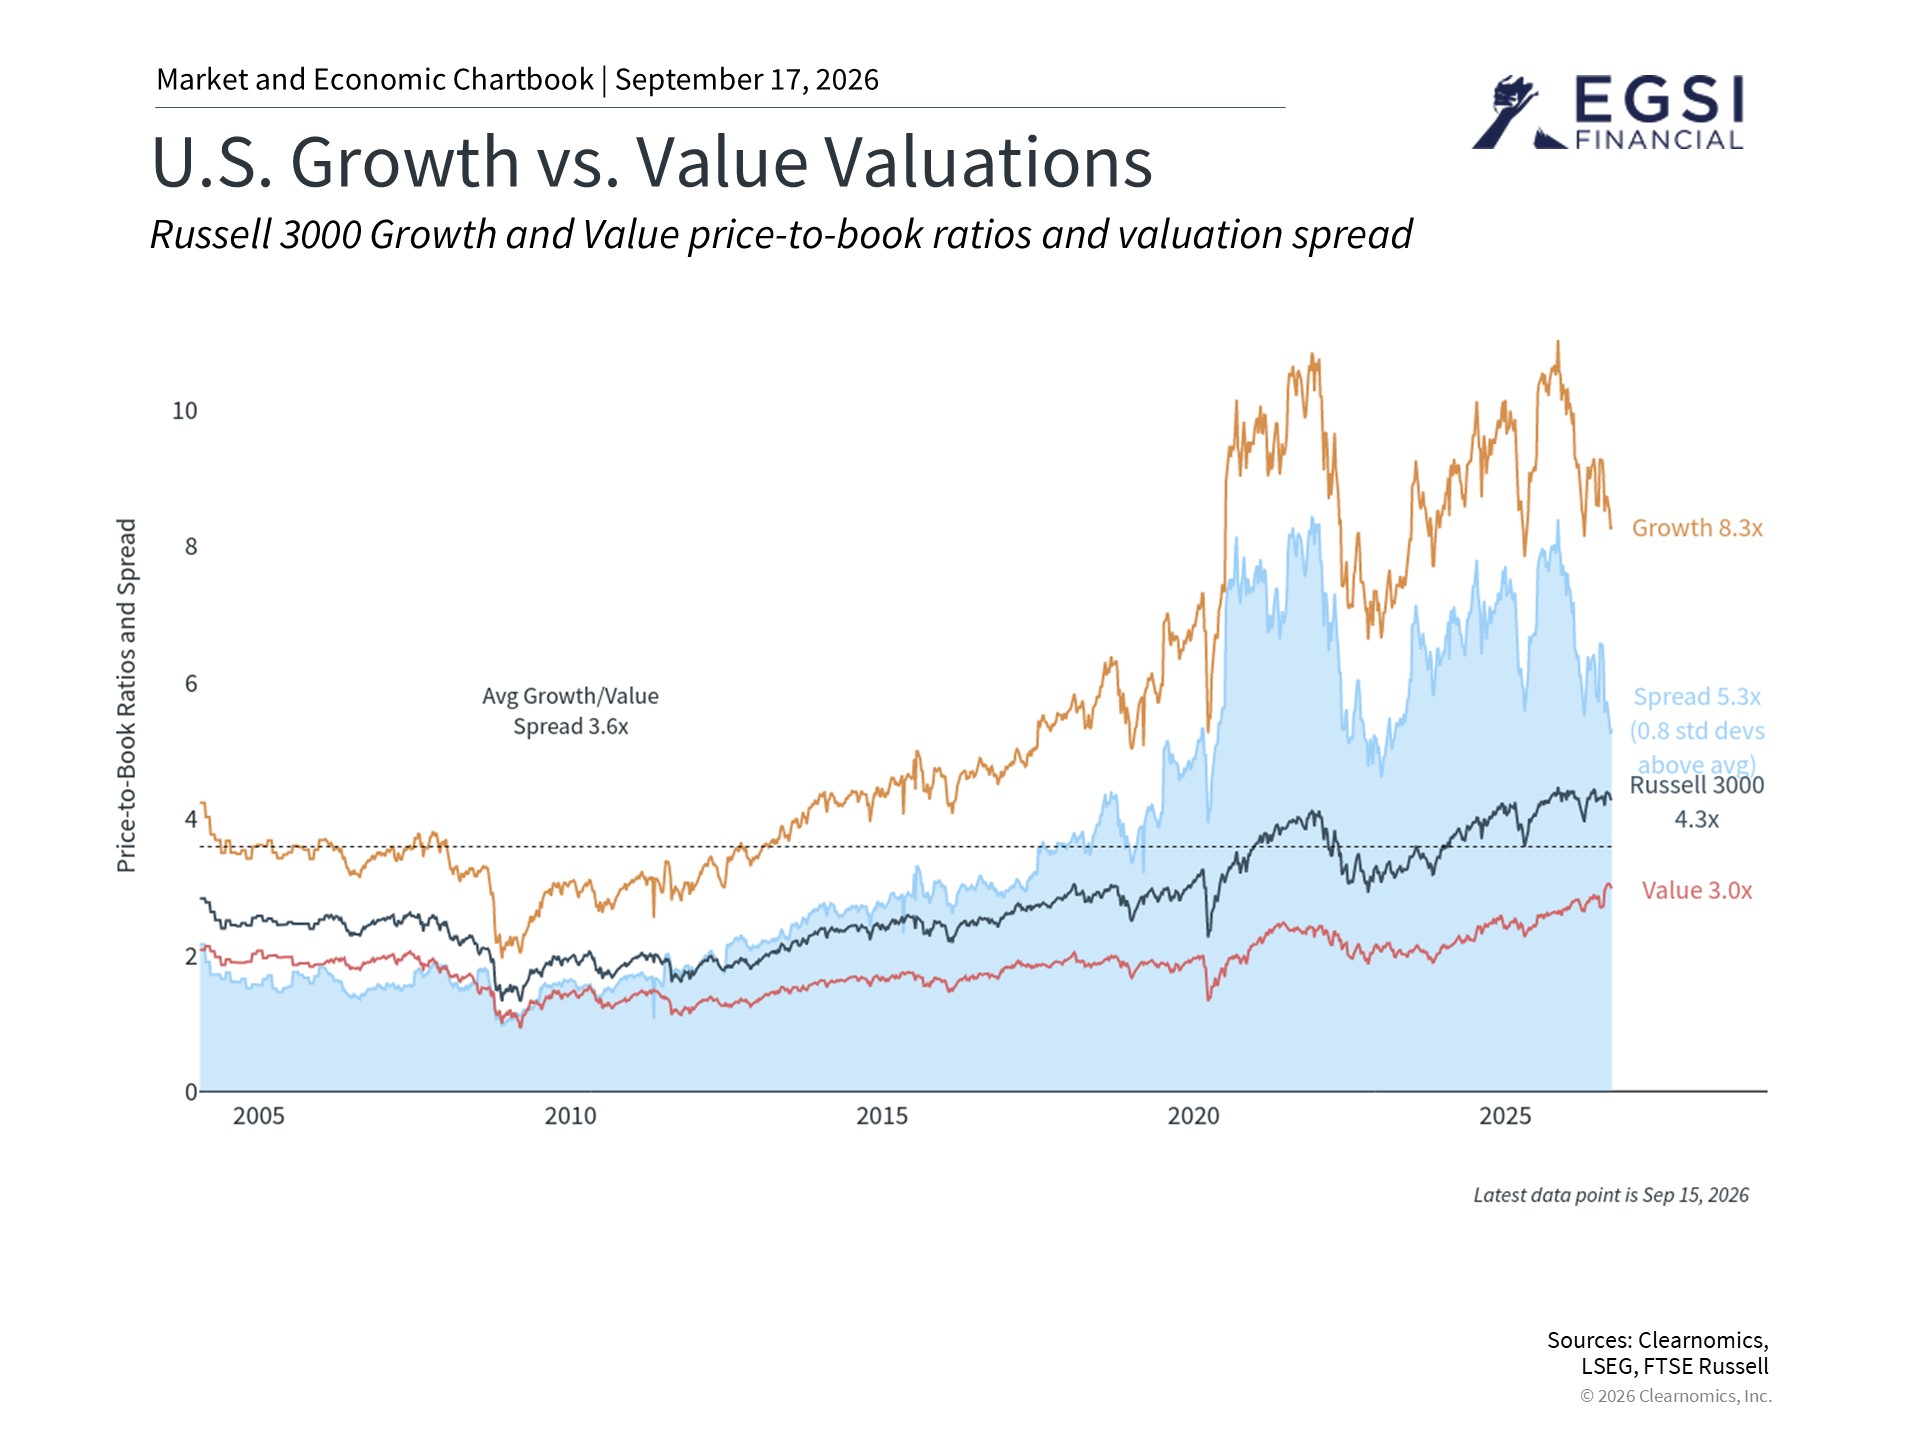
The significance of different stock market styles goes beyond just recent performance. Valuations, which refer to how expensive or affordable a stock is relative to its financial results, also matter. Historically, stocks with lower valuations have tended to produce better returns over the long run, so it is worth paying attention to all parts of the market.
The stock market is often described as going through “regimes,” meaning periods when a particular investment style tends to do better than others. These periods can last months, years, or even decades. One well-known example is that value stocks led for much of the 20th century, until growth stocks took the lead during the dot-com era.
The accompanying chart shows the difference in valuations between growth and value stocks using a measure called the price-to-book ratio, which compares a stock’s market price to its accounting value. Growth stocks, especially the largest technology companies, are currently near historically high valuations.7 By contrast, value stocks and smaller companies appear more reasonably priced. As always, past performance does not guarantee future results, so these valuation differences do not ensure that value or small cap stocks will keep outperforming. However, they do help explain the recent shift in market leadership and why investors may want to consider a variety of market segments in their portfolios.
The key lesson here is not to try to predict or time these shifts, but to recognize that no single trend lasts forever. Maintaining a thoughtful balance across different investment styles and company sizes, rather than simply chasing whatever has recently performed well, has historically served long-term investors well.
International markets offer an additional layer of diversification
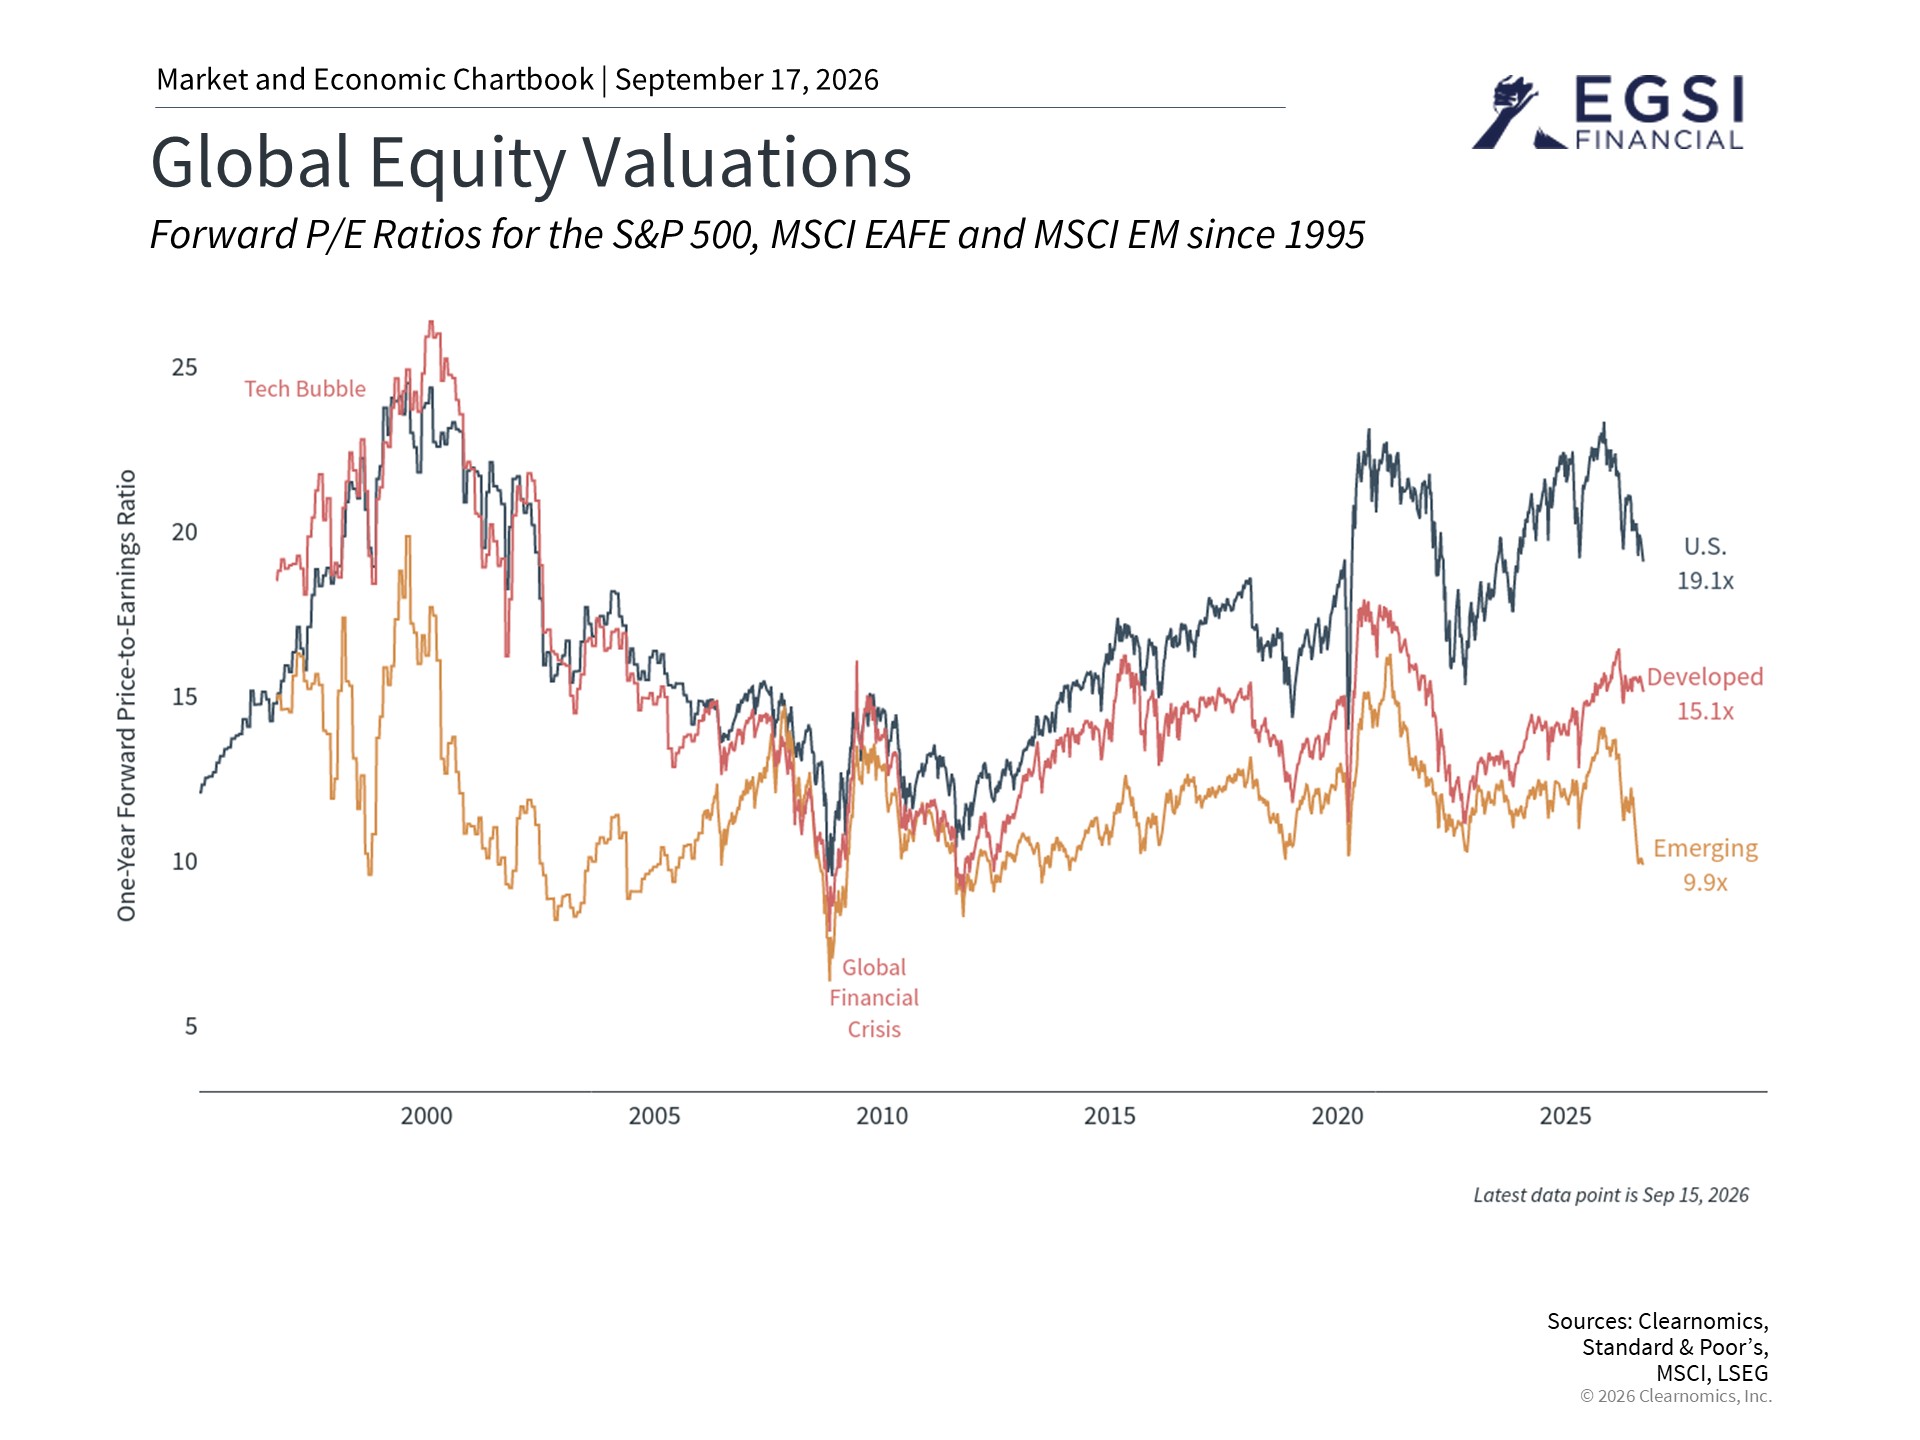
The same logic that applies to different investment styles within the U.S. also applies across countries. Just as different company sizes and styles respond differently to economic conditions, so do stock markets around the world. This is why spreading investments across international markets can be a valuable strategy for long-term investors.
Emerging market stocks, for example, have done well this year as earnings growth expectations have improved and valuations have become more appealing.8 The accompanying chart shows that valuations for both emerging market and developed market stocks outside the U.S. remain well below U.S. levels across several measures. While U.S. stocks led for much of the past decade, returns since the start of last year show that this leadership can shift in unexpected ways.
Of course, investing internationally comes with its own set of risks, including geopolitical uncertainty, currency fluctuations, and differences in regulations. These risks are part of why international stocks tend to behave differently from U.S. stocks over time. It is also worth noting that many large U.S. companies earn a significant portion of their revenues from outside the country, which already provides some geographic exposure. When international investments are combined thoughtfully with domestic ones, they can help improve the overall balance of a portfolio.
Ultimately, which parts of the market belong in a portfolio depends on each investor’s individual needs, goals, and comfort with risk. The goal is not to predict whether small caps will keep leading or whether value stocks will continue to outperform. Rather, it is about recognizing that the stock market is far broader than the handful of companies that tend to dominate the news.
The bottom line? While major market indices are a helpful starting point, different parts of the stock market behave in distinct ways. Maintaining a balanced approach across company sizes, investment styles, and geographic regions is an important step toward building a portfolio that supports long-term financial goals.
References
1. S&P 500 Index as of September 11, 2026
2. Clearnomics research and the Russell 3000 Value and Growth indexes, as of September 11, 2026
3. Fama and French, 1992, “The Cross-Section of Expected Stock Returns,” https://www.jstor.org/stable/2329112
4. Clearnomics research, LSEG and FTSE Russell, as of September 11, 2026
5. Clearnomics research and the Russell 2000 Index, as of September 11, 2026
6. Banz, 1981, “The Relationship Between Return and Market Value of Common Stock,” https://www.sciencedirect.com/science/article/abs/pii/0304405X81900180
7. Clearnomics research, LSEG and FTSE Russell, as of September 11, 2026
8. Clearnomics research and the MSCI Emerging Markets Index, as of September 11, 2026
Index Descriptions
S&P 500
The Standard & Poor’s 500 Index is a capitalization-weighted index of 500 stocks designed to measure performance of the broad domestic economy through changes in the aggregate market value of 500 stocks representing all major industries.
Russell 3000
The Russell 3000 Index is a stock market index that tracks the performance of the 3,000 largest companies listed on the U.S. stock exchange.
Russell 2000
The Russell 2000 Index is a capitalization-weighted index designed to measure the performance of the small-cap segment of the U.S. equity universe. It includes approximately 2,000 of the smallest securities in the Russell 3000 Index.
MSCI Emerging Markets Index
The MSCI EM (Emerging Markets) Index is a free float-adjusted market capitalization weighted index that is designed to measure the equity market performance of the emerging market countries of the Americas, Europe, the Middle East, Africa and Asia. The MSCI EM Index consists of the following emerging market country indices: Brazil, Chile, Colombia, Mexico, Peru, Czech Republic, Egypt, Greece, Hungary, Poland, Qatar, Russia, South Africa, Turkey, United Arab Emirates, China, India, Indonesia, Korea, Malaysia, Philippines, Taiwan, and Thailand.
MSCI EAFE Index
The MSCI EAFE Index is a free float-adjusted market capitalization index that is designed to measure the equity market performance of developed markets, excluding the US & Canada. The MSCI EAFE Index consists of the following developed country indices: Australia, Austria, Belgium, Denmark, Finland, France, Germany, Hong Kong, Ireland, Israel, Italy, Japan, the Netherlands, New Zealand, Norway, Portugal, Singapore, Spain, Sweden, Switzerland and the UK.
We are an independent financial services firm helping individuals create retirement strategies using a variety of investment and insurance products to custom suit their needs and objectives.
Advisory services offered through EGSI Investment Management, Inc., a Registered Investment Advisor with the State of Ohio. Insurance services offered through EGSI Financial, Inc.
Investing involves risk, including the potential loss of principal. No investment strategy can guarantee a profit or protect against loss in periods of declining values. None of the information contained on this website shall constitute an offer to sell or solicit any offer to buy a security or any insurance product.
Any references to protection benefits, safety, security, or steady and lifetime income streams on this website refer only to fixed insurance products. They do not refer, in any way, to securities or investment advisory products. Annuity guarantees are backed by the financial strength and claims-paying ability of the issuing insurance company. Annuities are insurance products that may be subject to fees, surrender charges and holding periods which vary by insurance company. Annuities are not FDIC insured.
The information and opinions contained in any of the material requested from this website are provided by third parties and have been obtained from sources believed to be reliable, but accuracy and completeness cannot be guaranteed. They are given for informational purposes only and are not a solicitation to buy or sell any of the products mentioned. The information is not intended to be used as the sole basis for financial decisions, nor should it be construed as advice designed to meet the particular needs of an individual’s situation.
Investing involves risk, including the potential loss of principal. No investment strategy can guarantee a profit or protect against loss in periods of declining values. None of the information contained on this website shall constitute an offer to sell or solicit any offer to buy a security or any insurance product.
Any references to protection benefits or steady and reliable income streams on this website refer only to fixed insurance products. They do not refer, in any way, to securities or investment advisory products. Annuity guarantees are backed by the financial strength and claims-paying ability of the issuing insurance company. Annuities are insurance products that may be subject to fees, surrender charges and holding periods which vary by insurance company. Annuities are not FDIC insured.
The information and opinions contained in any of the material requested from this website are provided by third parties and have been obtained from sources believed to be reliable, but accuracy and completeness cannot be guaranteed. They are given for informational purposes only and are not a solicitation to buy or sell any of the products mentioned. The information is not intended to be used as the sole basis for financial decisions, nor should it be construed as advice designed to meet the particular needs of an individual’s situation.