

The 19th century geologist Charles Lyell made popular the concept of “uniformitarianism,” a long word that captures a simple idea: the natural forces shaping the earth today are the same ones that have always shaped it throughout history. A similar principle applies to commodities we pull from the ground, like oil and copper. While events such as wars, tariffs, and AI are influencing commodity prices right now, it is ultimately supply and demand that drives these markets over the long run.
Commodities, as an asset class (a group of similar investments), have not only outperformed other investments this year, but have also provided support to other parts of the market, including U.S. stocks. Investors pay close attention to commodities because they tend to reflect the health of the broader economy. Oil prices have moved up and down from month to month, copper has climbed to new record highs, and precious metals surged to all-time highs early in the year before giving back some of those gains. Short-term price swings in commodities are common, and the forces behind them, including geopolitics, tariffs, and shifting economic trends, are hard to predict.
For investors, the key question is not where oil or copper will trade next week. What matters more is what supply and demand tell us about the broader economy, long-run trends, and how commodities fit into a well-built portfolio. Commodities can act as signals of global conditions, and their price swings are a natural part of how they work. So how can investors keep their perspective when commodity markets are moving sharply?
Oil prices remain tied to geopolitical uncertainty
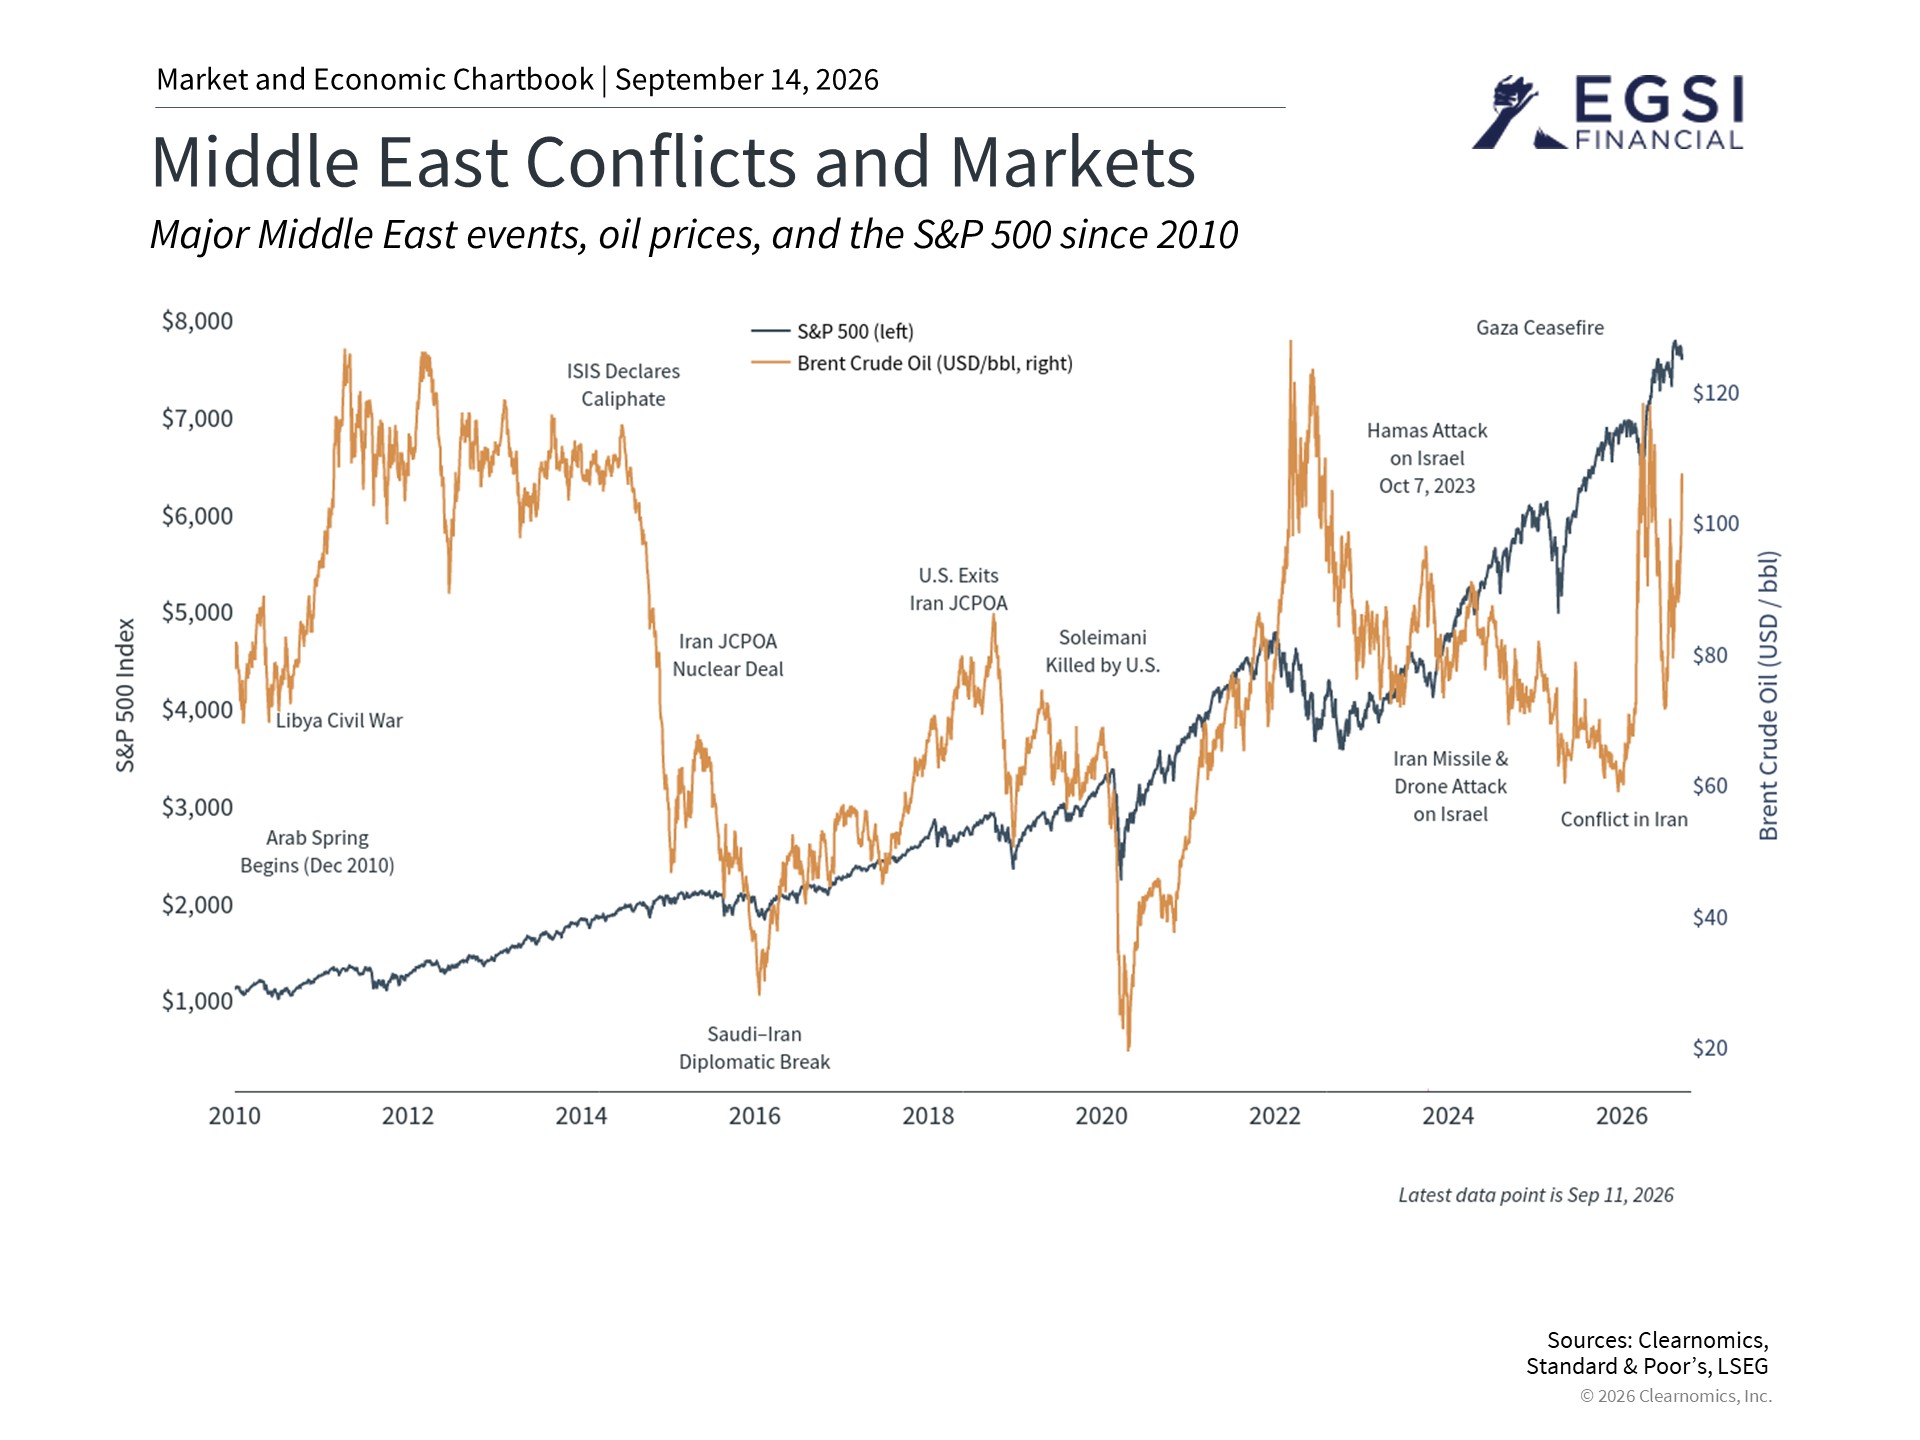
Oil markets have seen dramatic swings this year, showing both how sensitive they can be to world events and how difficult it is to forecast commodity prices. Oil jumped to multi-year highs back in March when the war in Iran began. Since then, Brent crude (a widely used global oil price benchmark) has ranged from as low as $72 per barrel at the start of July back toward $100 as of today, touching a seven-week high.
The main driver of these swings is the ongoing conflict in the Middle East, which has continued despite multiple ceasefire attempts and failed peace talks. Most recently, the Houthis, a group of militants based in Yemen, carried out strikes on Saudi Arabian energy infrastructure. This raised fresh concerns about disruptions to regional oil supply and pushed Brent crude back toward $100 per barrel.
While the Strait of Hormuz, which connects the Persian Gulf to the rest of the world, remains the main focus in energy markets, Houthi forces have also continued to target the Bab al-Mandab Strait, another important shipping route. Because it sits at the southern entrance to the Red Sea, it has become an increasingly important path for Saudi oil exports. Taken together, hostilities across the Middle East have made the shipping of oil extremely fragile.
For everyday consumers, these moves show up directly at the gas pump. The national average for regular grade gasoline has hovered around $4.15 per gallon according to AAA, and over $5.00 per gallon for premium. These levels have kept energy costs elevated and overall inflation higher than policymakers would prefer.1 This has affected inflation numbers all year, since the energy component makes up over 7% of the total Consumer Price Index (a measure of how much everyday goods and services cost).2
From a historical standpoint, this kind of oil price volatility is not unusual. During the Russia-Ukraine conflict in 2022, for instance, Brent crude surpassed $120 per barrel before declining sharply. In the mid-2000s, oil stayed around $100 for several years as global demand grew rapidly ahead of the financial crisis. Today, it is clear that high oil prices are primarily the result of geopolitics rather than an overheating economy. In addition, with the U.S. now producing more than 13.8 million barrels per day, it is somewhat more protected from these shocks than it was in the past.3
Copper reflects both trade policy and long-term structural demand
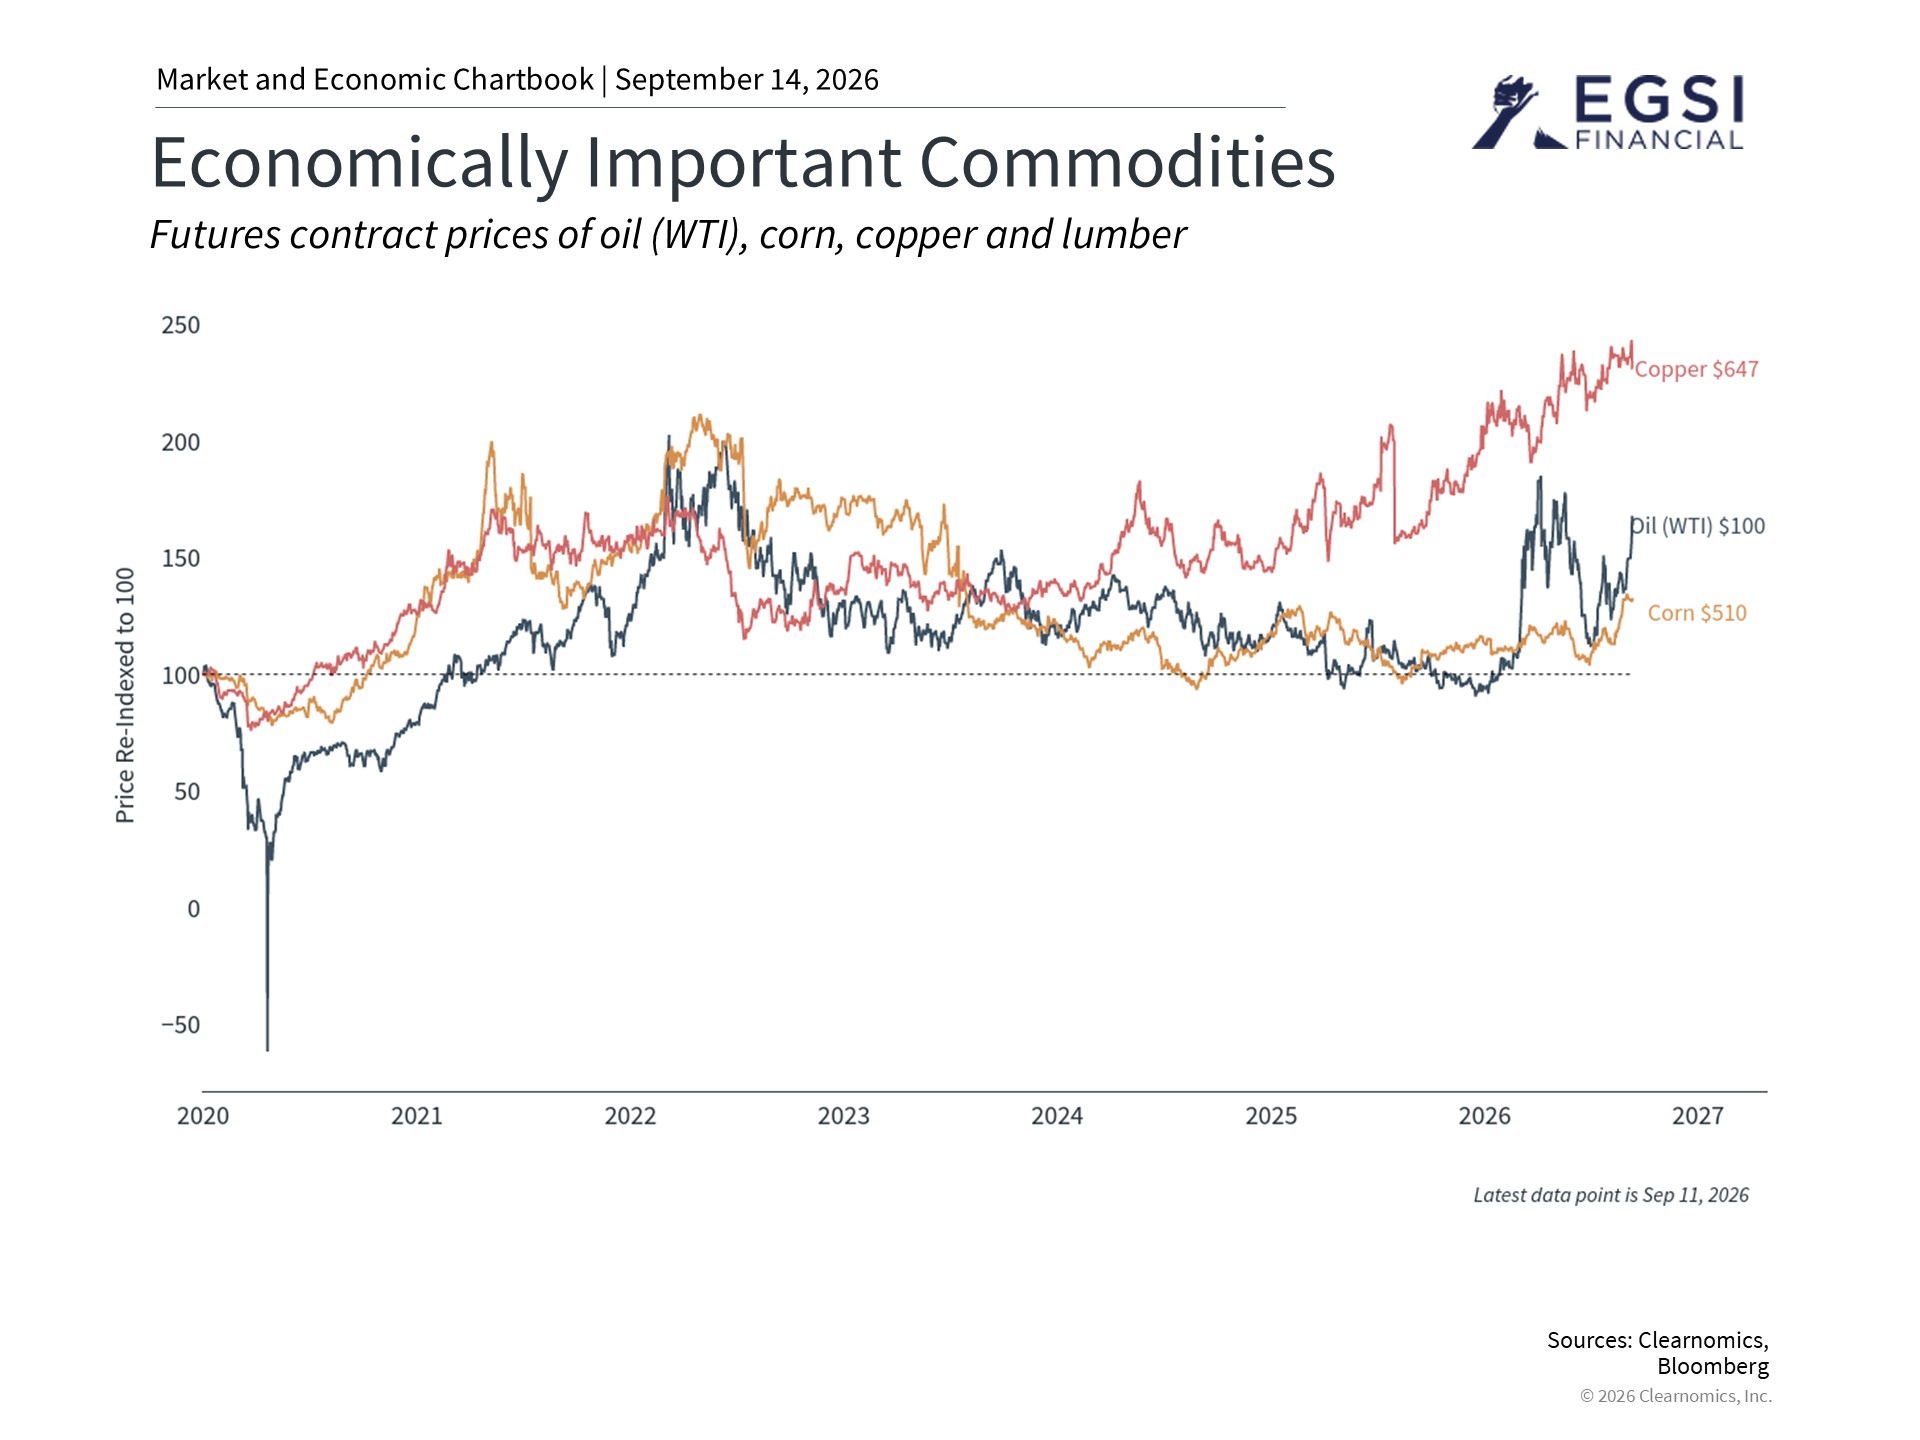
While oil has been the biggest commodity story this year, copper has also reached its own record highs. Investors often use the nickname “Dr. Copper” for the metal, since it is seen as a forward-looking economic indicator. That is because copper is used in a wide variety of industries, from building construction and energy, to electronics and transportation, making it a useful gauge of economic activity.
The most recent jump in copper prices is mainly driven by two factors: tariff concerns combined with tight supply, and strong long-term demand from trends such as AI data centers. On the tariff side, there are concerns about potential new U.S. import charges on refined copper. It may seem surprising that the U.S. would consider additional tariffs on such an important material, but the goal is to encourage domestic production for national security reasons. These tariffs are being explored under Section 232 of the Trade Expansion Act of 1962, which is designed to reduce reliance on foreign sources for sensitive goods.4 These issues, along with tight supplies and slower production, have pushed copper prices higher.
At the same time, demand for copper has increased as well. AI data centers, for example, naturally use thousands of tons of copper.5 Copper is a critical part of power delivery systems, including electrical wiring, and it is very efficient at transferring heat. This makes it essential for keeping large data centers and thousands of semiconductor chips cool. As large technology companies continue to build out bigger data centers, the need for copper has continued to grow.
Like most commodities, prices and demand can shift quickly, but it takes a long time to bring new production online. This naturally leads to large price swings. While copper is different from precious metals, there are similarities with the big rallies and pullbacks seen in gold and silver at the start of the year. Across all of these metals, the key takeaway is the importance of maintaining a longer-term perspective and not overreacting to short-term price moves.
Commodities are best viewed in a portfolio context
For long-term investors, what matters most is what commodities tell us about the broader economic environment, and how these assets behave within a diversified portfolio (one that spreads investments across many different types of assets to manage risk).
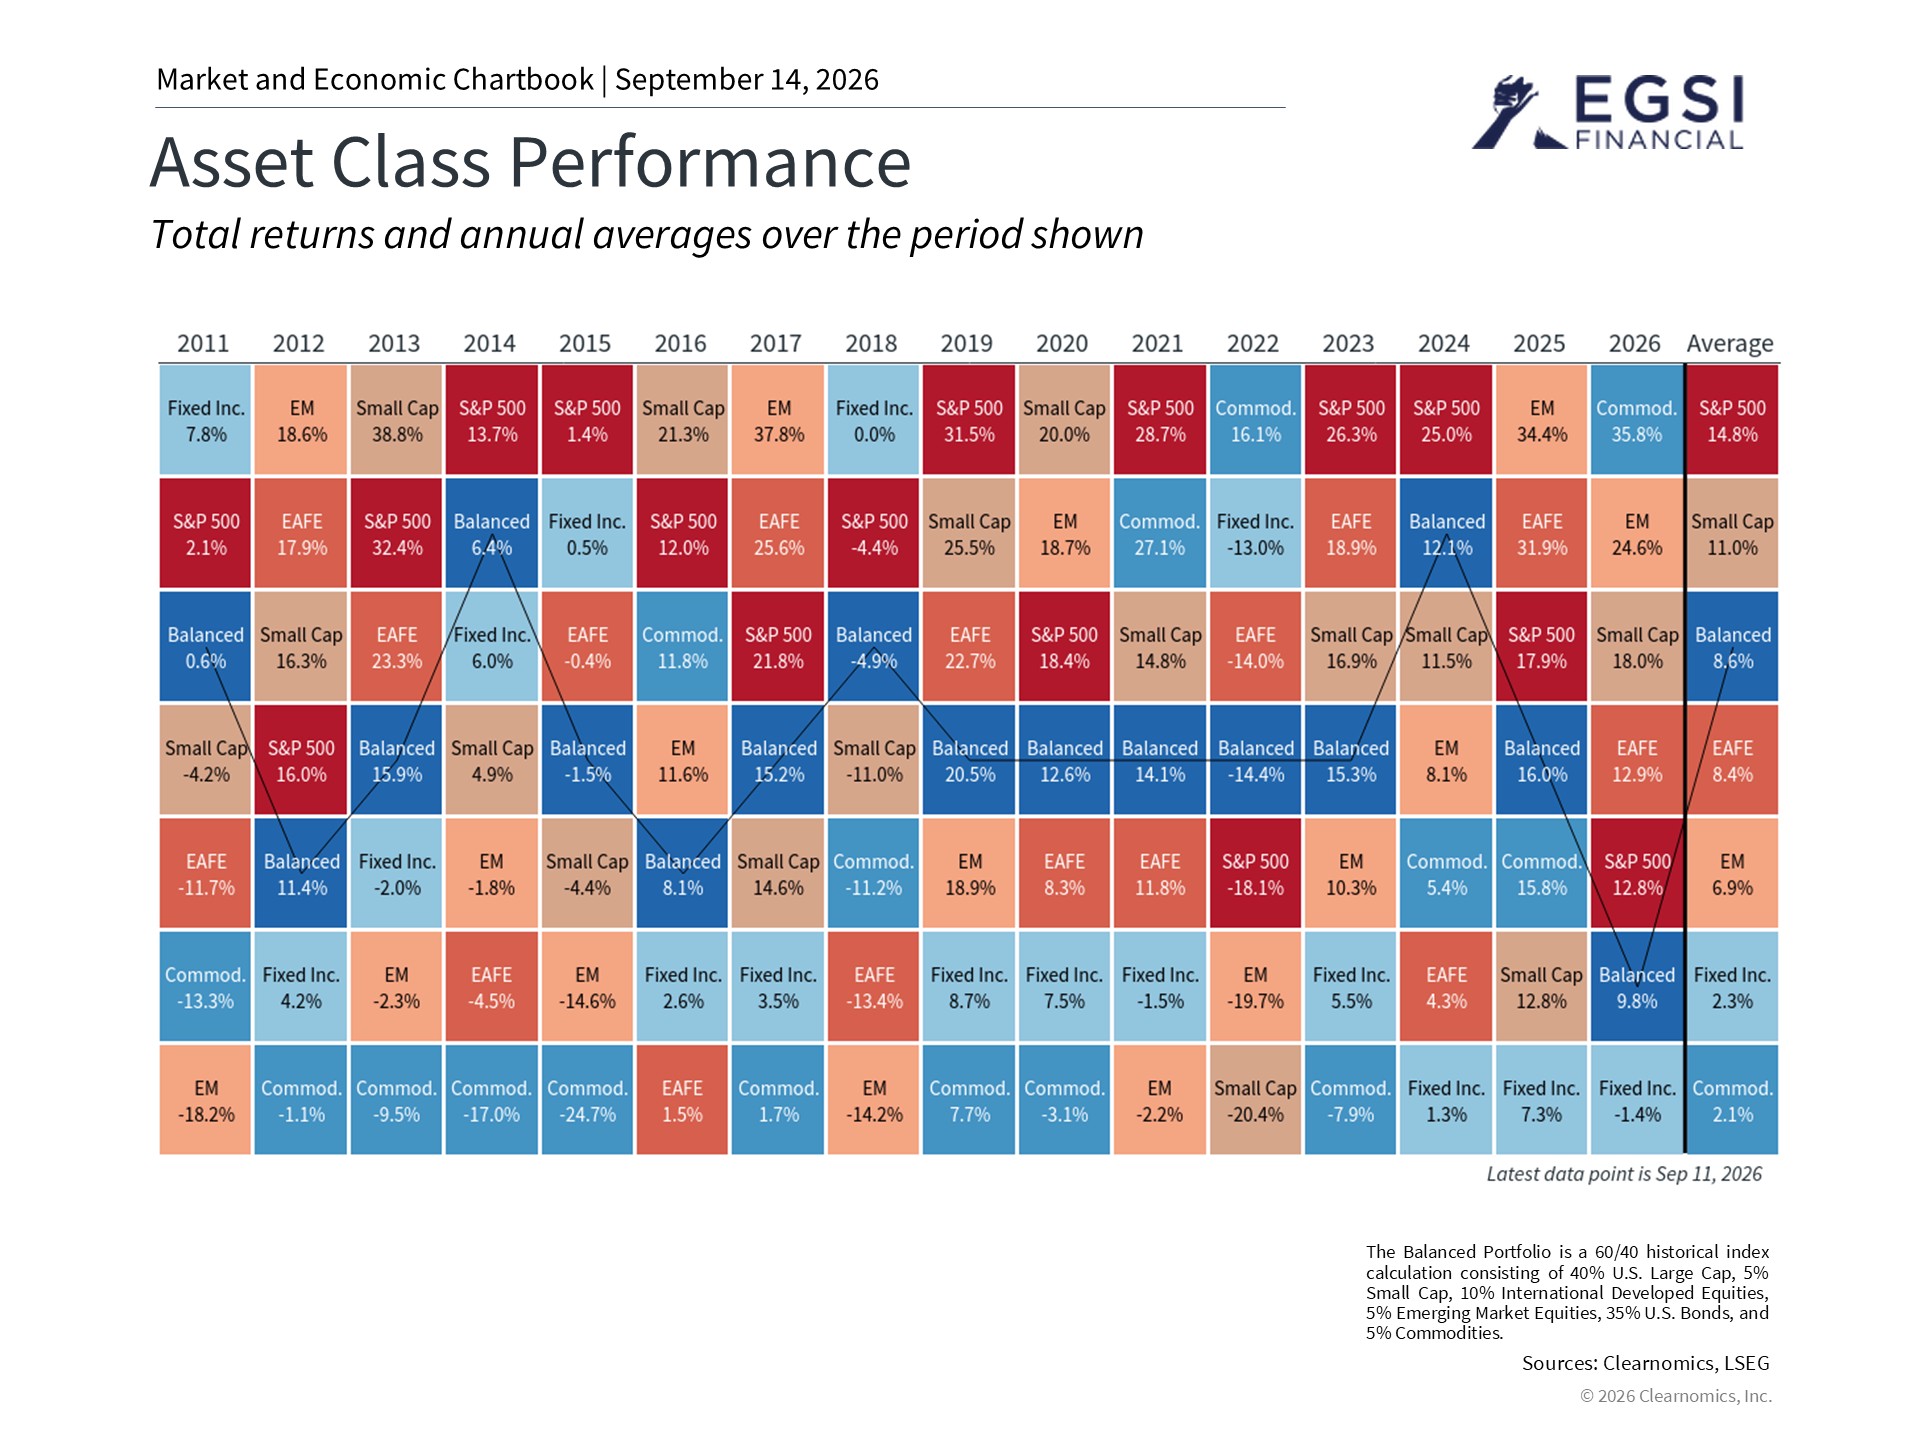
So far this year, the Bloomberg Commodity Index is the top-performing asset class, reflecting high oil prices as well as the supply and demand dynamics for other metals and materials. The chart above shows how volatile (subject to large price swings) commodities can be, with the asset class outperforming in some years and underperforming in many others.
What is most encouraging is that many other asset classes have also performed well this year. Emerging market stocks, small caps, U.S. stocks, and other major asset classes have all delivered solid returns. This is partly because these parts of the market also benefit from higher commodity prices. The energy sector, for instance, has been the best-performing sector within the S&P 500 for this very reason.
All of this highlights the importance of thinking in terms of a full portfolio, rather than focusing on any single asset class or investment. A well-built portfolio is designed to benefit from a variety of trends that can interact in complex ways, while also managing risk. The goal throughout is to help investors achieve their long-term financial objectives.
The bottom line? Commodity prices are sensitive to geopolitics, trade policy, and economic cycles. A balanced portfolio that includes exposure to different asset classes remains the best way to navigate these swings to achieve financial success.
Index Descriptions
S&P 500
The Standard & Poor’s 500 Index is a capitalization-weighted index of 500 stocks designed to measure performance of the broad domestic economy through changes in the aggregate market value of 500 stocks representing all major industries.
Bloomberg Commodity Index
The Bloomberg Commodity Index is a broadly diversified financial benchmark that tracks the price performance of futures contracts on physical commodities across multiple sectors.
References
1. https://gasprices.aaa.com/
2. https://www.bls.gov/cpi/tables/relative-importance/home.htm
3. https://www.eia.gov/dnav/pet/hist/leafhandler.ashx?n=pet&s=mcrfpus2&f=m
4. https://www.congress.gov/crs-product/IN12614
5. https://www.spglobal.com/en/research-insights/special-reports/copper-in-the-age-of-ai
We are an independent financial services firm helping individuals create retirement strategies using a variety of investment and insurance products to custom suit their needs and objectives.
Advisory services offered through EGSI Investment Management, Inc., a Registered Investment Advisor with the State of Ohio. Insurance services offered through EGSI Financial, Inc.
Investing involves risk, including the potential loss of principal. No investment strategy can guarantee a profit or protect against loss in periods of declining values. None of the information contained on this website shall constitute an offer to sell or solicit any offer to buy a security or any insurance product.
Any references to protection benefits, safety, security, or steady and lifetime income streams on this website refer only to fixed insurance products. They do not refer, in any way, to securities or investment advisory products. Annuity guarantees are backed by the financial strength and claims-paying ability of the issuing insurance company. Annuities are insurance products that may be subject to fees, surrender charges and holding periods which vary by insurance company. Annuities are not FDIC insured.
The information and opinions contained in any of the material requested from this website are provided by third parties and have been obtained from sources believed to be reliable, but accuracy and completeness cannot be guaranteed. They are given for informational purposes only and are not a solicitation to buy or sell any of the products mentioned. The information is not intended to be used as the sole basis for financial decisions, nor should it be construed as advice designed to meet the particular needs of an individual’s situation.
Investing involves risk, including the potential loss of principal. No investment strategy can guarantee a profit or protect against loss in periods of declining values. None of the information contained on this website shall constitute an offer to sell or solicit any offer to buy a security or any insurance product.
Any references to protection benefits or steady and reliable income streams on this website refer only to fixed insurance products. They do not refer, in any way, to securities or investment advisory products. Annuity guarantees are backed by the financial strength and claims-paying ability of the issuing insurance company. Annuities are insurance products that may be subject to fees, surrender charges and holding periods which vary by insurance company. Annuities are not FDIC insured.
The information and opinions contained in any of the material requested from this website are provided by third parties and have been obtained from sources believed to be reliable, but accuracy and completeness cannot be guaranteed. They are given for informational purposes only and are not a solicitation to buy or sell any of the products mentioned. The information is not intended to be used as the sole basis for financial decisions, nor should it be construed as advice designed to meet the particular needs of an individual’s situation.